| Full name: collagen type XIX alpha 1 chain | Alias Symbol: | ||
| Type: protein-coding gene | Cytoband: 6q13 | ||
| Entrez ID: 1310 | HGNC ID: HGNC:2196 | Ensembl Gene: ENSG00000082293 | OMIM ID: 120165 |
Expression of COL19A1:
| Dataset | Gene | EntrezID | Probe | Log2FC | Adj.pValue | Expression |
|---|---|---|---|---|---|---|
| GSE17351 | COL19A1 | 1310 | 211011_at | -0.0448 | 0.8558 | |
| GSE20347 | COL19A1 | 1310 | 211011_at | 0.0310 | 0.6671 | |
| GSE23400 | COL19A1 | 1310 | 211011_at | -0.0950 | 0.0049 | |
| GSE26886 | COL19A1 | 1310 | 211011_at | 0.1958 | 0.0510 | |
| GSE29001 | COL19A1 | 1310 | 211011_at | -0.0397 | 0.7697 | |
| GSE38129 | COL19A1 | 1310 | 211011_at | -0.0381 | 0.5323 | |
| GSE45670 | COL19A1 | 1310 | 211011_at | 0.0649 | 0.5238 | |
| GSE53622 | COL19A1 | 1310 | 135476 | -2.1873 | 0.0000 | |
| GSE53624 | COL19A1 | 1310 | 59066 | 0.0190 | 0.8355 | |
| GSE63941 | COL19A1 | 1310 | 211011_at | -0.0120 | 0.9479 | |
| GSE77861 | COL19A1 | 1310 | 211011_at | -0.1419 | 0.1540 | |
| GSE97050 | COL19A1 | 1310 | A_23_P375922 | -0.7655 | 0.2844 | |
| SRP133303 | COL19A1 | 1310 | RNAseq | -1.7265 | 0.0019 | |
| SRP159526 | COL19A1 | 1310 | RNAseq | -0.7224 | 0.3256 | |
| TCGA | COL19A1 | 1310 | RNAseq | -1.8895 | 0.0094 |
Upregulated datasets: 0; Downregulated datasets: 3.
Survival by COL19A1 expression:
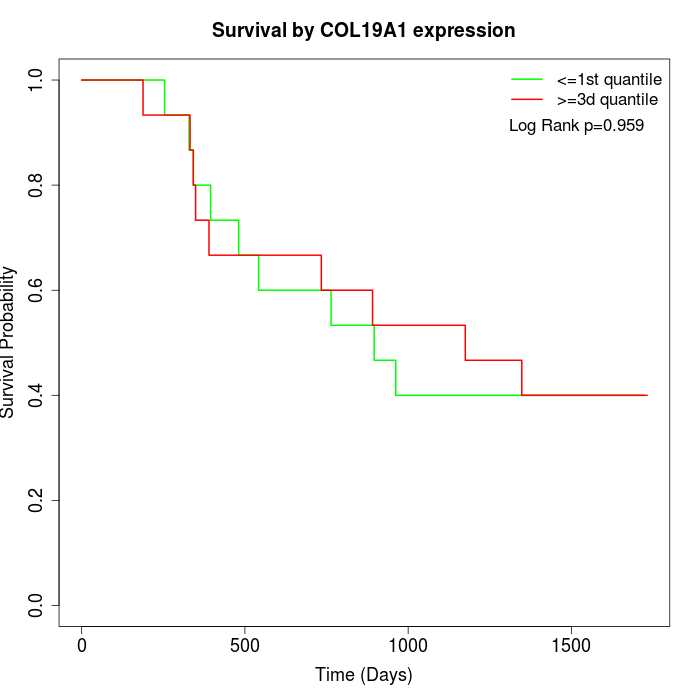 | 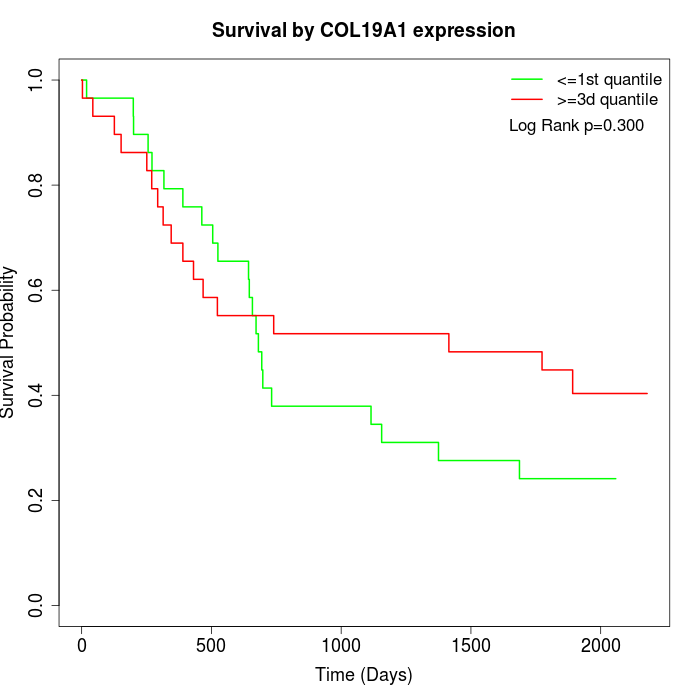 | 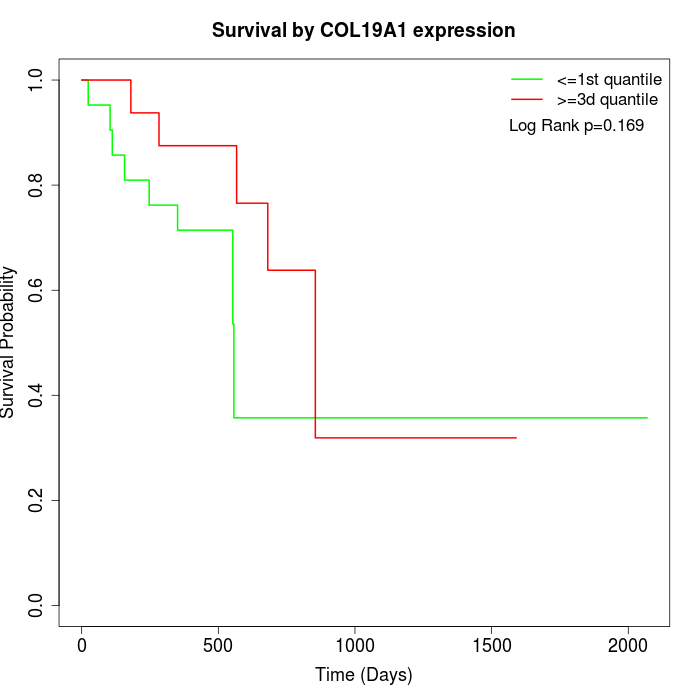 |
| GSE53622 | GSE53624 | TCGA |
Note: Click image to view full size file.
Copy number change of COL19A1:
| Dataset | Gene | EntrezID | Gain | Loss | Normal | Detail |
|---|---|---|---|---|---|---|
| GSE15526 | COL19A1 | 1310 | 2 | 2 | 26 | |
| GSE20123 | COL19A1 | 1310 | 2 | 2 | 26 | |
| GSE43470 | COL19A1 | 1310 | 3 | 0 | 40 | |
| GSE46452 | COL19A1 | 1310 | 2 | 11 | 46 | |
| GSE47630 | COL19A1 | 1310 | 8 | 4 | 28 | |
| GSE54993 | COL19A1 | 1310 | 3 | 2 | 65 | |
| GSE54994 | COL19A1 | 1310 | 11 | 4 | 38 | |
| GSE60625 | COL19A1 | 1310 | 0 | 2 | 9 | |
| GSE74703 | COL19A1 | 1310 | 3 | 0 | 33 | |
| GSE74704 | COL19A1 | 1310 | 0 | 2 | 18 | |
| TCGA | COL19A1 | 1310 | 12 | 19 | 65 |
Total number of gains: 46; Total number of losses: 48; Total Number of normals: 394.
Somatic mutations of COL19A1:
Generating mutation plots.
Highly correlated genes for COL19A1:
Showing top 20/623 corelated genes with mean PCC>0.5.
| Gene1 | Gene2 | Mean PCC | Num. Datasets | Num. PCC<0 | Num. PCC>0.5 |
|---|---|---|---|---|---|
| COL19A1 | CKMT2 | 0.739279 | 3 | 0 | 3 |
| COL19A1 | HSPB6 | 0.732594 | 3 | 0 | 3 |
| COL19A1 | CACNA1H | 0.706505 | 3 | 0 | 3 |
| COL19A1 | NFASC | 0.700148 | 3 | 0 | 3 |
| COL19A1 | ST6GALNAC3 | 0.697876 | 3 | 0 | 3 |
| COL19A1 | PLIN4 | 0.689237 | 3 | 0 | 3 |
| COL19A1 | PDE4DIP | 0.6874 | 3 | 0 | 3 |
| COL19A1 | PLN | 0.686952 | 3 | 0 | 3 |
| COL19A1 | ATP1A2 | 0.6865 | 3 | 0 | 3 |
| COL19A1 | MEF2D | 0.68601 | 4 | 0 | 4 |
| COL19A1 | SKP1 | 0.682614 | 3 | 0 | 3 |
| COL19A1 | FLNC | 0.681174 | 3 | 0 | 3 |
| COL19A1 | CADM2 | 0.676576 | 3 | 0 | 3 |
| COL19A1 | PHOX2A | 0.674632 | 4 | 0 | 3 |
| COL19A1 | BFSP2 | 0.674359 | 4 | 0 | 3 |
| COL19A1 | OR2J2 | 0.673371 | 3 | 0 | 3 |
| COL19A1 | PARD3B | 0.673216 | 4 | 0 | 3 |
| COL19A1 | PDZRN4 | 0.670619 | 3 | 0 | 3 |
| COL19A1 | SLC2A4 | 0.667248 | 5 | 0 | 4 |
| COL19A1 | EGLN2 | 0.666977 | 3 | 0 | 3 |
For details and further investigation, click here