| Full name: DIRAS family GTPase 1 | Alias Symbol: Di-Ras1|GBTS1|RIG | ||
| Type: protein-coding gene | Cytoband: 19p13.3 | ||
| Entrez ID: 148252 | HGNC ID: HGNC:19127 | Ensembl Gene: ENSG00000176490 | OMIM ID: 607862 |
Screen Evidence:
| |||
Expression of DIRAS1:
| Dataset | Gene | EntrezID | Probe | Log2FC | Adj.pValue | Expression |
|---|---|---|---|---|---|---|
| GSE17351 | DIRAS1 | 148252 | 226573_at | -0.2587 | 0.7105 | |
| GSE26886 | DIRAS1 | 148252 | 226573_at | -0.0524 | 0.8058 | |
| GSE45670 | DIRAS1 | 148252 | 226573_at | -0.0624 | 0.5726 | |
| GSE53622 | DIRAS1 | 148252 | 23440 | 0.0267 | 0.7919 | |
| GSE53624 | DIRAS1 | 148252 | 23440 | 0.1307 | 0.2612 | |
| GSE63941 | DIRAS1 | 148252 | 226573_at | -0.1013 | 0.8181 | |
| GSE77861 | DIRAS1 | 148252 | 226573_at | 0.0192 | 0.8626 | |
| GSE97050 | DIRAS1 | 148252 | A_23_P386942 | -0.1454 | 0.5693 | |
| SRP064894 | DIRAS1 | 148252 | RNAseq | -0.0763 | 0.8690 | |
| SRP133303 | DIRAS1 | 148252 | RNAseq | -0.9356 | 0.0765 | |
| SRP159526 | DIRAS1 | 148252 | RNAseq | -0.2258 | 0.6699 | |
| SRP219564 | DIRAS1 | 148252 | RNAseq | 0.2349 | 0.7830 | |
| TCGA | DIRAS1 | 148252 | RNAseq | -0.7576 | 0.0039 |
Upregulated datasets: 0; Downregulated datasets: 0.
Survival by DIRAS1 expression:
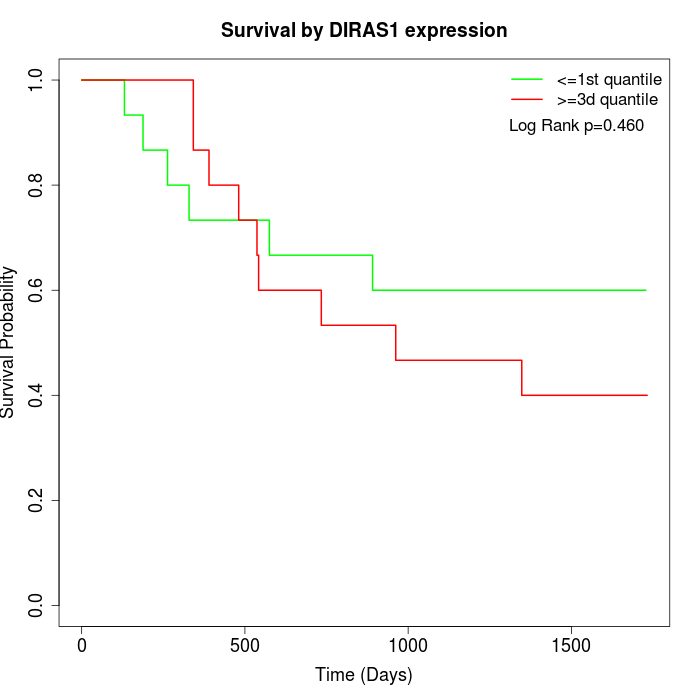 | 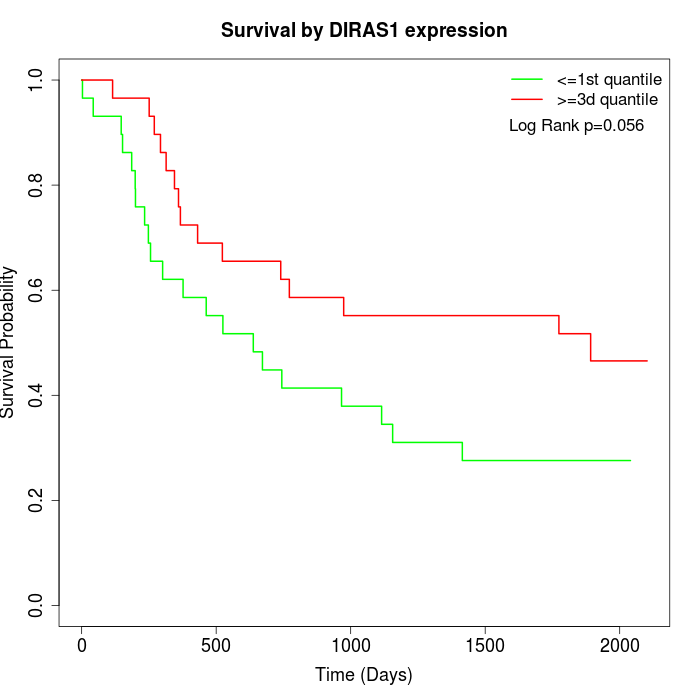 | 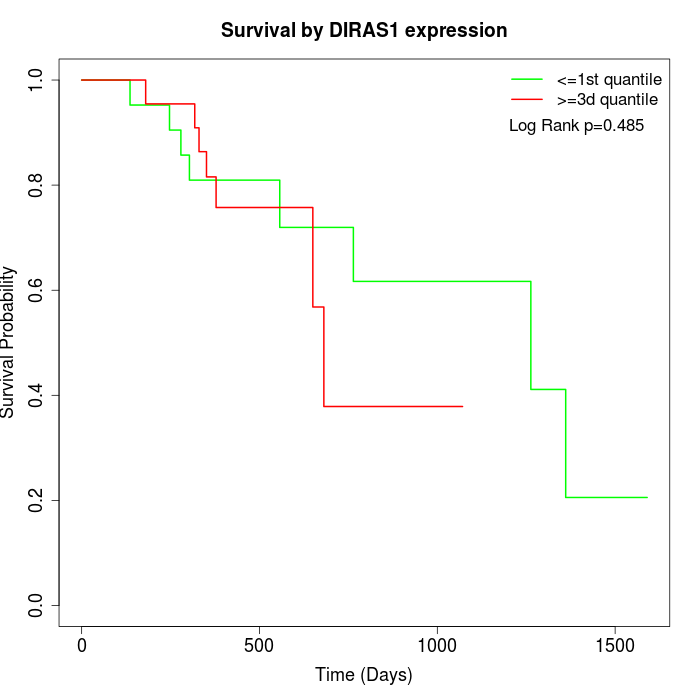 |
| GSE53622 | GSE53624 | TCGA |
Note: Click image to view full size file.
Copy number change of DIRAS1:
| Dataset | Gene | EntrezID | Gain | Loss | Normal | Detail |
|---|---|---|---|---|---|---|
| GSE15526 | DIRAS1 | 148252 | 4 | 4 | 22 | |
| GSE20123 | DIRAS1 | 148252 | 3 | 4 | 23 | |
| GSE43470 | DIRAS1 | 148252 | 1 | 9 | 33 | |
| GSE46452 | DIRAS1 | 148252 | 47 | 1 | 11 | |
| GSE47630 | DIRAS1 | 148252 | 5 | 7 | 28 | |
| GSE54993 | DIRAS1 | 148252 | 16 | 3 | 51 | |
| GSE54994 | DIRAS1 | 148252 | 8 | 16 | 29 | |
| GSE60625 | DIRAS1 | 148252 | 9 | 0 | 2 | |
| GSE74703 | DIRAS1 | 148252 | 1 | 6 | 29 | |
| GSE74704 | DIRAS1 | 148252 | 1 | 3 | 16 | |
| TCGA | DIRAS1 | 148252 | 7 | 23 | 66 |
Total number of gains: 102; Total number of losses: 76; Total Number of normals: 310.
Somatic mutations of DIRAS1:
Generating mutation plots.
Highly correlated genes for DIRAS1:
Showing top 20/202 corelated genes with mean PCC>0.5.
| Gene1 | Gene2 | Mean PCC | Num. Datasets | Num. PCC<0 | Num. PCC>0.5 |
|---|---|---|---|---|---|
| DIRAS1 | FRZB | 0.78512 | 3 | 0 | 3 |
| DIRAS1 | PLCL1 | 0.769223 | 3 | 0 | 3 |
| DIRAS1 | TSPYL2 | 0.76869 | 3 | 0 | 3 |
| DIRAS1 | GPC4 | 0.766238 | 3 | 0 | 3 |
| DIRAS1 | RXRG | 0.761405 | 3 | 0 | 3 |
| DIRAS1 | TBC1D17 | 0.741346 | 3 | 0 | 3 |
| DIRAS1 | NR1H2 | 0.723892 | 3 | 0 | 3 |
| DIRAS1 | ARHGAP4 | 0.72374 | 4 | 0 | 4 |
| DIRAS1 | SGCA | 0.723352 | 3 | 0 | 3 |
| DIRAS1 | PLA2G4C | 0.722141 | 3 | 0 | 3 |
| DIRAS1 | FCHO1 | 0.718135 | 4 | 0 | 4 |
| DIRAS1 | GYPC | 0.716107 | 3 | 0 | 3 |
| DIRAS1 | SGCD | 0.711288 | 3 | 0 | 3 |
| DIRAS1 | TCEA2 | 0.70855 | 3 | 0 | 3 |
| DIRAS1 | KLF16 | 0.699092 | 3 | 0 | 3 |
| DIRAS1 | BHMT2 | 0.698504 | 4 | 0 | 4 |
| DIRAS1 | INSRR | 0.693846 | 4 | 0 | 3 |
| DIRAS1 | KANK2 | 0.692887 | 3 | 0 | 3 |
| DIRAS1 | CNTNAP1 | 0.6902 | 4 | 0 | 4 |
| DIRAS1 | EPHA3 | 0.69002 | 4 | 0 | 3 |
For details and further investigation, click here