| Full name: DIRAS family GTPase 2 | Alias Symbol: Di-Ras2|DKFZp761C07121 | ||
| Type: protein-coding gene | Cytoband: 9q22.2 | ||
| Entrez ID: 54769 | HGNC ID: HGNC:19323 | Ensembl Gene: ENSG00000165023 | OMIM ID: 607863 |
Expression of DIRAS2:
| Dataset | Gene | EntrezID | Probe | Log2FC | Adj.pValue | Expression |
|---|---|---|---|---|---|---|
| GSE17351 | DIRAS2 | 54769 | 240122_at | 0.4207 | 0.2312 | |
| GSE20347 | DIRAS2 | 54769 | 219619_at | 0.2696 | 0.1329 | |
| GSE23400 | DIRAS2 | 54769 | 219619_at | 0.1600 | 0.0347 | |
| GSE26886 | DIRAS2 | 54769 | 240122_at | 0.2496 | 0.0418 | |
| GSE29001 | DIRAS2 | 54769 | 219619_at | 0.6710 | 0.3059 | |
| GSE38129 | DIRAS2 | 54769 | 219619_at | 0.6765 | 0.0126 | |
| GSE45670 | DIRAS2 | 54769 | 240122_at | 0.2096 | 0.2911 | |
| GSE53622 | DIRAS2 | 54769 | 99591 | 0.1369 | 0.6560 | |
| GSE53624 | DIRAS2 | 54769 | 99591 | 0.7639 | 0.0007 | |
| GSE63941 | DIRAS2 | 54769 | 219619_at | -2.8972 | 0.0043 | |
| GSE77861 | DIRAS2 | 54769 | 240122_at | 0.4033 | 0.3572 | |
| SRP159526 | DIRAS2 | 54769 | RNAseq | 5.9212 | 0.0000 | |
| TCGA | DIRAS2 | 54769 | RNAseq | 0.4917 | 0.4933 |
Upregulated datasets: 1; Downregulated datasets: 1.
Survival by DIRAS2 expression:
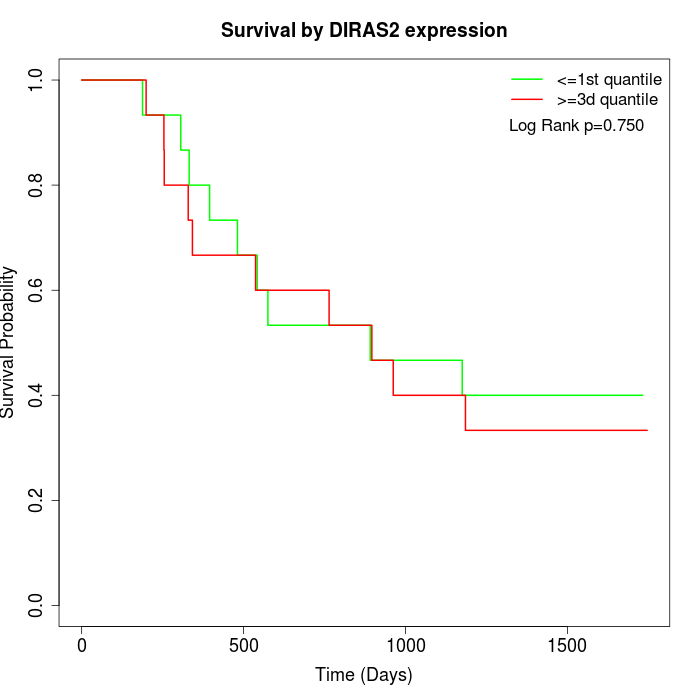 | 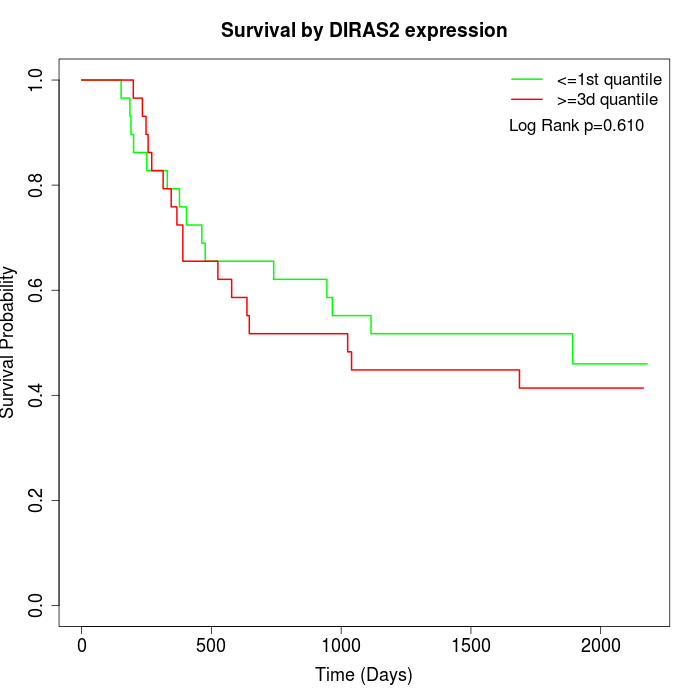 | 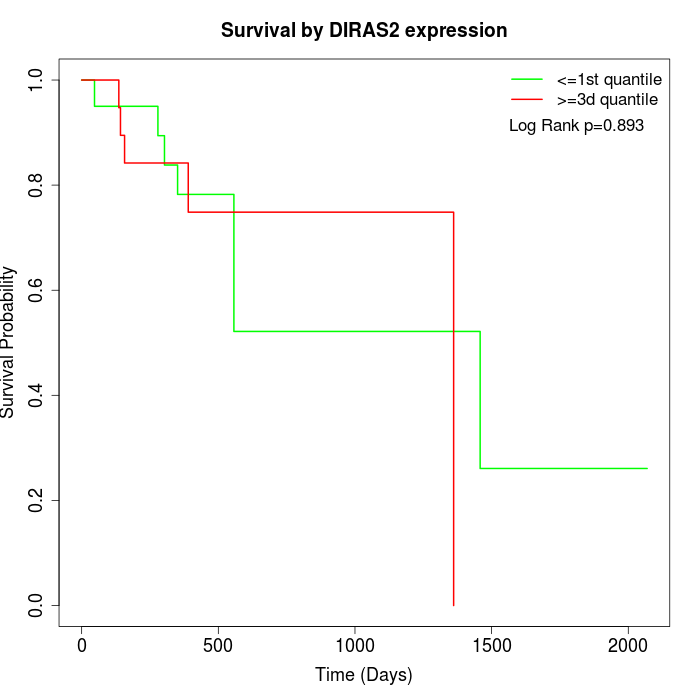 |
| GSE53622 | GSE53624 | TCGA |
Note: Click image to view full size file.
Copy number change of DIRAS2:
| Dataset | Gene | EntrezID | Gain | Loss | Normal | Detail |
|---|---|---|---|---|---|---|
| GSE15526 | DIRAS2 | 54769 | 6 | 10 | 14 | |
| GSE20123 | DIRAS2 | 54769 | 5 | 10 | 15 | |
| GSE43470 | DIRAS2 | 54769 | 6 | 3 | 34 | |
| GSE46452 | DIRAS2 | 54769 | 6 | 14 | 39 | |
| GSE47630 | DIRAS2 | 54769 | 1 | 18 | 21 | |
| GSE54993 | DIRAS2 | 54769 | 4 | 2 | 64 | |
| GSE54994 | DIRAS2 | 54769 | 7 | 11 | 35 | |
| GSE60625 | DIRAS2 | 54769 | 0 | 0 | 11 | |
| GSE74703 | DIRAS2 | 54769 | 5 | 3 | 28 | |
| GSE74704 | DIRAS2 | 54769 | 3 | 7 | 10 | |
| TCGA | DIRAS2 | 54769 | 22 | 24 | 50 |
Total number of gains: 65; Total number of losses: 102; Total Number of normals: 321.
Somatic mutations of DIRAS2:
Generating mutation plots.
Highly correlated genes for DIRAS2:
Showing top 20/63 corelated genes with mean PCC>0.5.
| Gene1 | Gene2 | Mean PCC | Num. Datasets | Num. PCC<0 | Num. PCC>0.5 |
|---|---|---|---|---|---|
| DIRAS2 | MCM3AP | 0.763632 | 3 | 0 | 3 |
| DIRAS2 | CLSTN2 | 0.667145 | 3 | 0 | 3 |
| DIRAS2 | DOK6 | 0.661163 | 3 | 0 | 3 |
| DIRAS2 | TNFAIP6 | 0.658171 | 3 | 0 | 3 |
| DIRAS2 | ADAMTS12 | 0.642669 | 3 | 0 | 3 |
| DIRAS2 | SH3RF3 | 0.634685 | 3 | 0 | 3 |
| DIRAS2 | GPER1 | 0.630089 | 4 | 0 | 3 |
| DIRAS2 | TNIP2 | 0.62863 | 3 | 0 | 3 |
| DIRAS2 | PROC | 0.616917 | 4 | 0 | 3 |
| DIRAS2 | PCDH9 | 0.615122 | 3 | 0 | 3 |
| DIRAS2 | DGCR5 | 0.606501 | 3 | 0 | 3 |
| DIRAS2 | TMEM163 | 0.604974 | 5 | 0 | 4 |
| DIRAS2 | ECE1 | 0.602251 | 5 | 0 | 3 |
| DIRAS2 | ANO1 | 0.596038 | 3 | 0 | 3 |
| DIRAS2 | EN1 | 0.594241 | 7 | 0 | 4 |
| DIRAS2 | NAV1 | 0.594002 | 3 | 0 | 3 |
| DIRAS2 | MYO9B | 0.58618 | 3 | 0 | 3 |
| DIRAS2 | UBR4 | 0.57908 | 3 | 0 | 3 |
| DIRAS2 | SCN9A | 0.578887 | 9 | 0 | 6 |
| DIRAS2 | CCNA1 | 0.568028 | 4 | 0 | 3 |
For details and further investigation, click here