| Full name: embryonic ectoderm development | Alias Symbol: WAIT-1|HEED | ||
| Type: protein-coding gene | Cytoband: 11q14.2 | ||
| Entrez ID: 8726 | HGNC ID: HGNC:3188 | Ensembl Gene: ENSG00000074266 | OMIM ID: 605984 |
| Related drugs: SULFINPYRAZONE... [more] | |||
Screen Evidence:
| |||
Expression of EED:
| Dataset | Gene | EntrezID | Probe | Log2FC | Adj.pValue | Expression |
|---|---|---|---|---|---|---|
| GSE17351 | EED | 8726 | 209572_s_at | 0.3964 | 0.1860 | |
| GSE20347 | EED | 8726 | 209572_s_at | 0.4580 | 0.0411 | |
| GSE23400 | EED | 8726 | 209572_s_at | 0.4772 | 0.0000 | |
| GSE26886 | EED | 8726 | 209572_s_at | -0.3457 | 0.2331 | |
| GSE29001 | EED | 8726 | 209572_s_at | 0.0060 | 0.9878 | |
| GSE38129 | EED | 8726 | 209572_s_at | 0.4697 | 0.0027 | |
| GSE45670 | EED | 8726 | 209572_s_at | 0.5091 | 0.0027 | |
| GSE53622 | EED | 8726 | 3451 | 0.3842 | 0.0000 | |
| GSE53624 | EED | 8726 | 3451 | 0.3777 | 0.0000 | |
| GSE63941 | EED | 8726 | 209572_s_at | 0.6395 | 0.2026 | |
| GSE77861 | EED | 8726 | 209572_s_at | 0.1187 | 0.6899 | |
| GSE97050 | EED | 8726 | A_23_P53217 | 0.3369 | 0.4861 | |
| SRP007169 | EED | 8726 | RNAseq | 0.5645 | 0.1256 | |
| SRP008496 | EED | 8726 | RNAseq | 0.2352 | 0.3415 | |
| SRP064894 | EED | 8726 | RNAseq | 0.4383 | 0.0488 | |
| SRP133303 | EED | 8726 | RNAseq | 0.1400 | 0.4285 | |
| SRP159526 | EED | 8726 | RNAseq | -0.1393 | 0.6099 | |
| SRP193095 | EED | 8726 | RNAseq | -0.0435 | 0.7728 | |
| SRP219564 | EED | 8726 | RNAseq | -0.2123 | 0.3682 | |
| TCGA | EED | 8726 | RNAseq | 0.0828 | 0.1702 |
Upregulated datasets: 0; Downregulated datasets: 0.
Survival by EED expression:
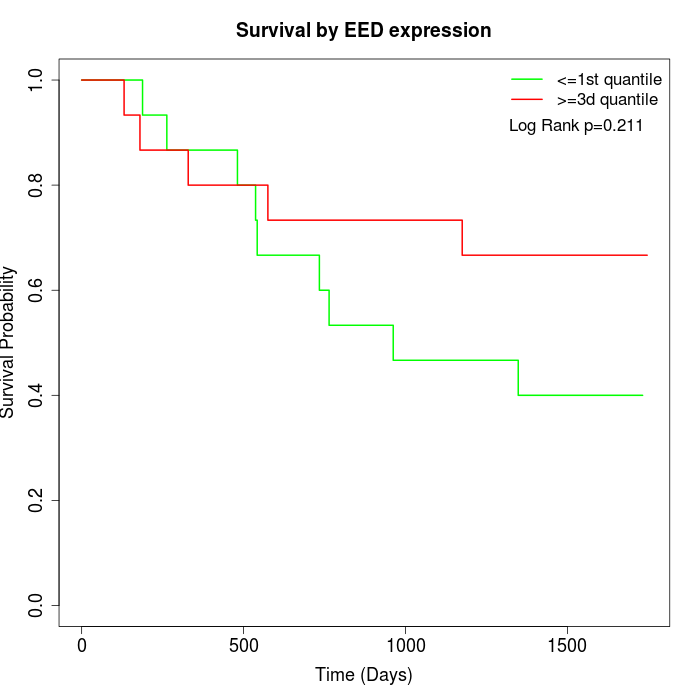 | 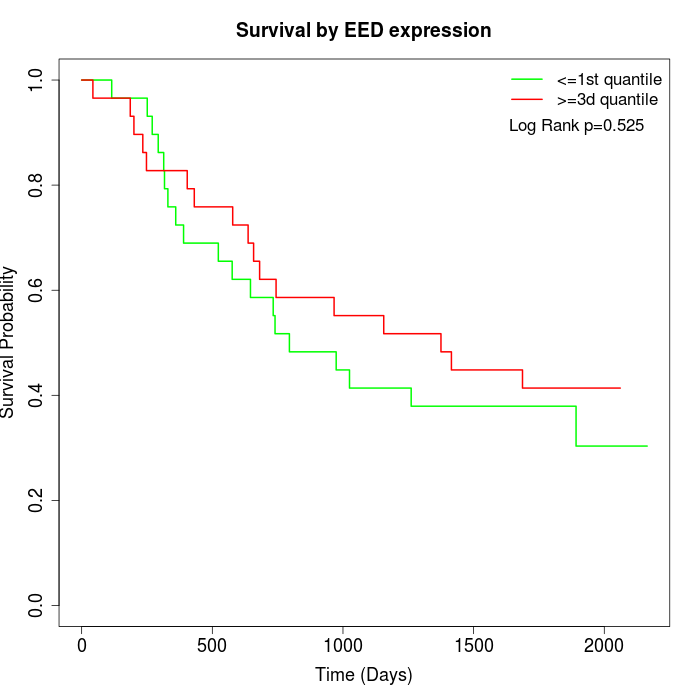 | 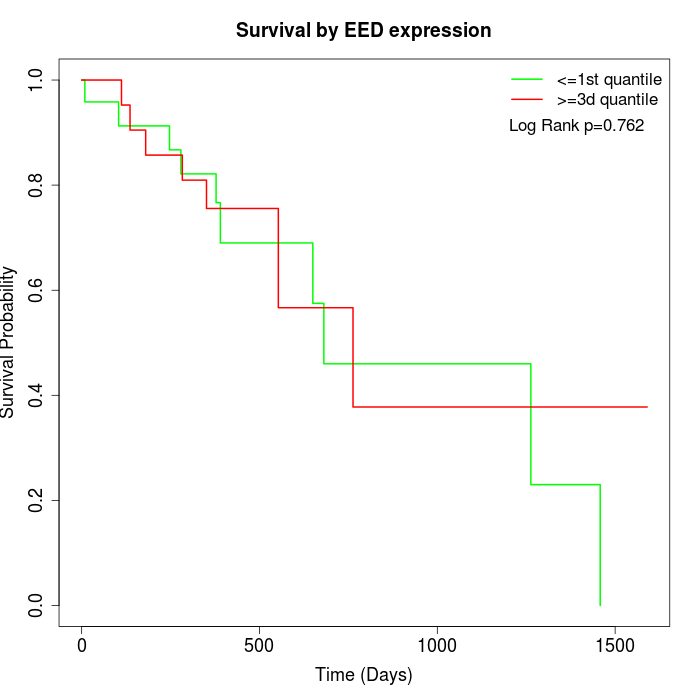 |
| GSE53622 | GSE53624 | TCGA |
Note: Click image to view full size file.
Copy number change of EED:
| Dataset | Gene | EntrezID | Gain | Loss | Normal | Detail |
|---|---|---|---|---|---|---|
| GSE15526 | EED | 8726 | 4 | 9 | 17 | |
| GSE20123 | EED | 8726 | 4 | 9 | 17 | |
| GSE43470 | EED | 8726 | 3 | 4 | 36 | |
| GSE46452 | EED | 8726 | 5 | 24 | 30 | |
| GSE47630 | EED | 8726 | 2 | 19 | 19 | |
| GSE54993 | EED | 8726 | 8 | 2 | 60 | |
| GSE54994 | EED | 8726 | 6 | 18 | 29 | |
| GSE60625 | EED | 8726 | 0 | 3 | 8 | |
| GSE74703 | EED | 8726 | 2 | 3 | 31 | |
| GSE74704 | EED | 8726 | 3 | 6 | 11 | |
| TCGA | EED | 8726 | 16 | 37 | 43 |
Total number of gains: 53; Total number of losses: 134; Total Number of normals: 301.
Somatic mutations of EED:
Generating mutation plots.
Highly correlated genes for EED:
Showing top 20/878 corelated genes with mean PCC>0.5.
| Gene1 | Gene2 | Mean PCC | Num. Datasets | Num. PCC<0 | Num. PCC>0.5 |
|---|---|---|---|---|---|
| EED | RASA2 | 0.808862 | 3 | 0 | 3 |
| EED | DUSP23 | 0.763391 | 3 | 0 | 3 |
| EED | LETM1 | 0.756047 | 3 | 0 | 3 |
| EED | TADA1 | 0.735374 | 3 | 0 | 3 |
| EED | YTHDF3 | 0.735367 | 3 | 0 | 3 |
| EED | MRFAP1 | 0.73479 | 3 | 0 | 3 |
| EED | SFR1 | 0.729728 | 3 | 0 | 3 |
| EED | PPP1R8 | 0.725386 | 3 | 0 | 3 |
| EED | THUMPD1 | 0.721543 | 3 | 0 | 3 |
| EED | STX16 | 0.712631 | 3 | 0 | 3 |
| EED | AHCY | 0.711815 | 3 | 0 | 3 |
| EED | GK5 | 0.711406 | 3 | 0 | 3 |
| EED | CREBZF | 0.711309 | 11 | 0 | 10 |
| EED | PITRM1 | 0.707298 | 3 | 0 | 3 |
| EED | NAA30 | 0.707119 | 3 | 0 | 3 |
| EED | METTL14 | 0.704406 | 3 | 0 | 3 |
| EED | GDE1 | 0.701763 | 3 | 0 | 3 |
| EED | TMEM126B | 0.70105 | 12 | 0 | 10 |
| EED | SMARCC1 | 0.69553 | 3 | 0 | 3 |
| EED | MRPL14 | 0.691266 | 6 | 0 | 6 |
For details and further investigation, click here