| Full name: interferon induced protein with tetratricopeptide repeats 1 | Alias Symbol: GARG-16 | ||
| Type: protein-coding gene | Cytoband: 10q23.31 | ||
| Entrez ID: 3434 | HGNC ID: HGNC:5407 | Ensembl Gene: ENSG00000185745 | OMIM ID: 147690 |
IFIT1 involved pathways:
| KEGG pathway | Description | View |
|---|---|---|
| hsa05160 | Hepatitis C |
Expression of IFIT1:
| Dataset | Gene | EntrezID | Probe | Log2FC | Adj.pValue | Expression |
|---|---|---|---|---|---|---|
| GSE17351 | IFIT1 | 3434 | 203153_at | 0.3377 | 0.8749 | |
| GSE20347 | IFIT1 | 3434 | 203153_at | 1.6655 | 0.0024 | |
| GSE23400 | IFIT1 | 3434 | 203153_at | 1.0922 | 0.0000 | |
| GSE26886 | IFIT1 | 3434 | 203153_at | 1.3192 | 0.0424 | |
| GSE29001 | IFIT1 | 3434 | 203153_at | 2.3605 | 0.0010 | |
| GSE38129 | IFIT1 | 3434 | 203153_at | 1.0424 | 0.0244 | |
| GSE45670 | IFIT1 | 3434 | 203153_at | 1.9843 | 0.0028 | |
| GSE53622 | IFIT1 | 3434 | 63996 | 0.8883 | 0.0002 | |
| GSE53624 | IFIT1 | 3434 | 63996 | 1.7141 | 0.0000 | |
| GSE63941 | IFIT1 | 3434 | 203153_at | -1.2268 | 0.4815 | |
| GSE77861 | IFIT1 | 3434 | 203153_at | 0.5435 | 0.3441 | |
| GSE97050 | IFIT1 | 3434 | A_23_P52266 | 0.0422 | 0.9304 | |
| SRP007169 | IFIT1 | 3434 | RNAseq | 2.3683 | 0.0000 | |
| SRP008496 | IFIT1 | 3434 | RNAseq | 2.6595 | 0.0000 | |
| SRP064894 | IFIT1 | 3434 | RNAseq | 2.6184 | 0.0000 | |
| SRP133303 | IFIT1 | 3434 | RNAseq | 0.8805 | 0.0067 | |
| SRP159526 | IFIT1 | 3434 | RNAseq | -0.4120 | 0.6181 | |
| SRP193095 | IFIT1 | 3434 | RNAseq | 1.9322 | 0.0000 | |
| SRP219564 | IFIT1 | 3434 | RNAseq | 0.6910 | 0.4559 | |
| TCGA | IFIT1 | 3434 | RNAseq | 0.7454 | 0.0000 |
Upregulated datasets: 11; Downregulated datasets: 0.
Survival by IFIT1 expression:
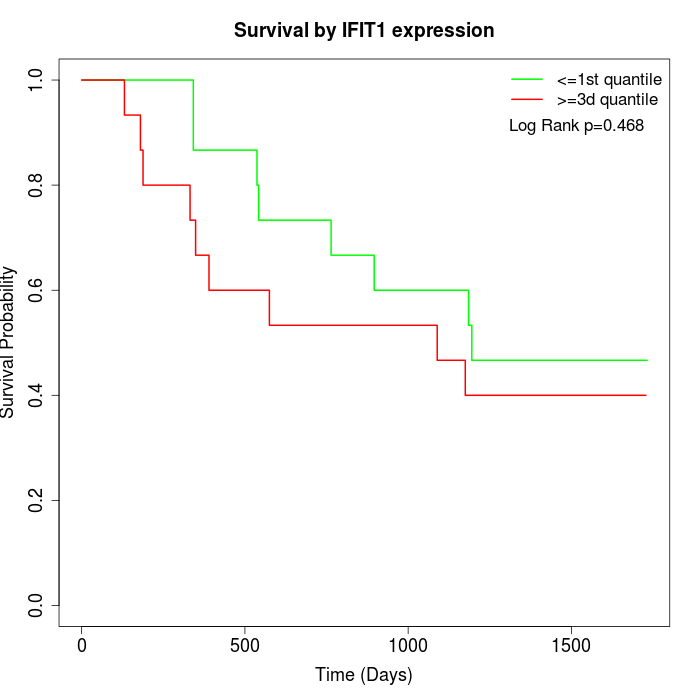 | 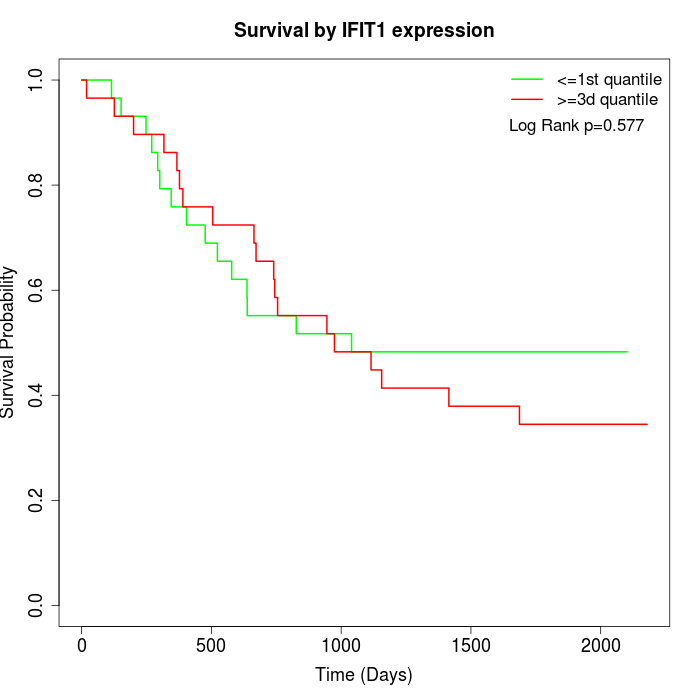 | 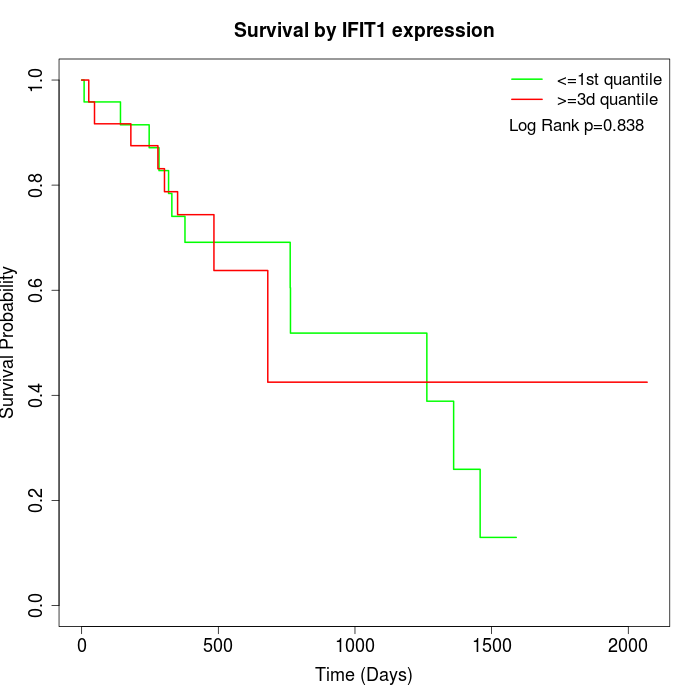 |
| GSE53622 | GSE53624 | TCGA |
Note: Click image to view full size file.
Copy number change of IFIT1:
| Dataset | Gene | EntrezID | Gain | Loss | Normal | Detail |
|---|---|---|---|---|---|---|
| GSE15526 | IFIT1 | 3434 | 2 | 7 | 21 | |
| GSE20123 | IFIT1 | 3434 | 2 | 6 | 22 | |
| GSE43470 | IFIT1 | 3434 | 0 | 8 | 35 | |
| GSE46452 | IFIT1 | 3434 | 0 | 11 | 48 | |
| GSE47630 | IFIT1 | 3434 | 2 | 14 | 24 | |
| GSE54993 | IFIT1 | 3434 | 7 | 0 | 63 | |
| GSE54994 | IFIT1 | 3434 | 1 | 11 | 41 | |
| GSE60625 | IFIT1 | 3434 | 0 | 0 | 11 | |
| GSE74703 | IFIT1 | 3434 | 0 | 6 | 30 | |
| GSE74704 | IFIT1 | 3434 | 1 | 4 | 15 | |
| TCGA | IFIT1 | 3434 | 7 | 27 | 62 |
Total number of gains: 22; Total number of losses: 94; Total Number of normals: 372.
Somatic mutations of IFIT1:
Generating mutation plots.
Highly correlated genes for IFIT1:
Showing top 20/424 corelated genes with mean PCC>0.5.
| Gene1 | Gene2 | Mean PCC | Num. Datasets | Num. PCC<0 | Num. PCC>0.5 |
|---|---|---|---|---|---|
| IFIT1 | IFI44L | 0.853245 | 13 | 0 | 13 |
| IFIT1 | IFI44 | 0.839059 | 13 | 0 | 13 |
| IFIT1 | IFIT3 | 0.831109 | 13 | 0 | 12 |
| IFIT1 | IFI6 | 0.820502 | 13 | 0 | 13 |
| IFIT1 | RSAD2 | 0.813517 | 13 | 0 | 13 |
| IFIT1 | DDX60 | 0.808201 | 13 | 0 | 13 |
| IFIT1 | ISG15 | 0.793665 | 12 | 0 | 12 |
| IFIT1 | MX1 | 0.779512 | 12 | 0 | 12 |
| IFIT1 | IFI35 | 0.763655 | 13 | 0 | 13 |
| IFIT1 | HERC5 | 0.761428 | 13 | 0 | 12 |
| IFIT1 | XAF1 | 0.754055 | 13 | 0 | 13 |
| IFIT1 | CMPK2 | 0.753656 | 9 | 0 | 7 |
| IFIT1 | RBM39 | 0.749003 | 3 | 0 | 3 |
| IFIT1 | EPSTI1 | 0.741972 | 8 | 0 | 8 |
| IFIT1 | IFITM1 | 0.740317 | 9 | 0 | 9 |
| IFIT1 | IFIH1 | 0.733684 | 11 | 0 | 10 |
| IFIT1 | DDX60L | 0.730375 | 7 | 0 | 7 |
| IFIT1 | IFIT5 | 0.728644 | 13 | 0 | 12 |
| IFIT1 | USP41 | 0.72567 | 3 | 0 | 3 |
| IFIT1 | SP100 | 0.724312 | 13 | 0 | 12 |
For details and further investigation, click here