| Full name: F-box protein 2 | Alias Symbol: FBX2|Nfb42|Fbs1|Fbg1 | ||
| Type: protein-coding gene | Cytoband: 1p36.22 | ||
| Entrez ID: 26232 | HGNC ID: HGNC:13581 | Ensembl Gene: ENSG00000116661 | OMIM ID: 607112 |
Expression of FBXO2:
| Dataset | Gene | EntrezID | Probe | Log2FC | Adj.pValue | Expression |
|---|---|---|---|---|---|---|
| GSE17351 | FBXO2 | 26232 | 219305_x_at | 0.7900 | 0.4219 | |
| GSE20347 | FBXO2 | 26232 | 219305_x_at | 0.1474 | 0.4680 | |
| GSE23400 | FBXO2 | 26232 | 219305_x_at | 0.1608 | 0.1313 | |
| GSE26886 | FBXO2 | 26232 | 219305_x_at | 0.7327 | 0.0181 | |
| GSE29001 | FBXO2 | 26232 | 219305_x_at | 0.0470 | 0.9128 | |
| GSE38129 | FBXO2 | 26232 | 219305_x_at | -0.0564 | 0.7823 | |
| GSE45670 | FBXO2 | 26232 | 219305_x_at | 0.2017 | 0.4840 | |
| GSE53622 | FBXO2 | 26232 | 108519 | -0.0402 | 0.8420 | |
| GSE53624 | FBXO2 | 26232 | 108519 | -0.1000 | 0.5477 | |
| GSE63941 | FBXO2 | 26232 | 219305_x_at | 0.4504 | 0.5597 | |
| GSE77861 | FBXO2 | 26232 | 219305_x_at | -0.0589 | 0.8183 | |
| GSE97050 | FBXO2 | 26232 | A_23_P45999 | 0.7457 | 0.2206 | |
| SRP064894 | FBXO2 | 26232 | RNAseq | 0.9718 | 0.0486 | |
| SRP133303 | FBXO2 | 26232 | RNAseq | 0.0738 | 0.8951 | |
| SRP159526 | FBXO2 | 26232 | RNAseq | 0.9554 | 0.2413 | |
| SRP193095 | FBXO2 | 26232 | RNAseq | 0.5805 | 0.0796 | |
| SRP219564 | FBXO2 | 26232 | RNAseq | 0.0857 | 0.8845 | |
| TCGA | FBXO2 | 26232 | RNAseq | 0.1099 | 0.6600 |
Upregulated datasets: 0; Downregulated datasets: 0.
Survival by FBXO2 expression:
 | 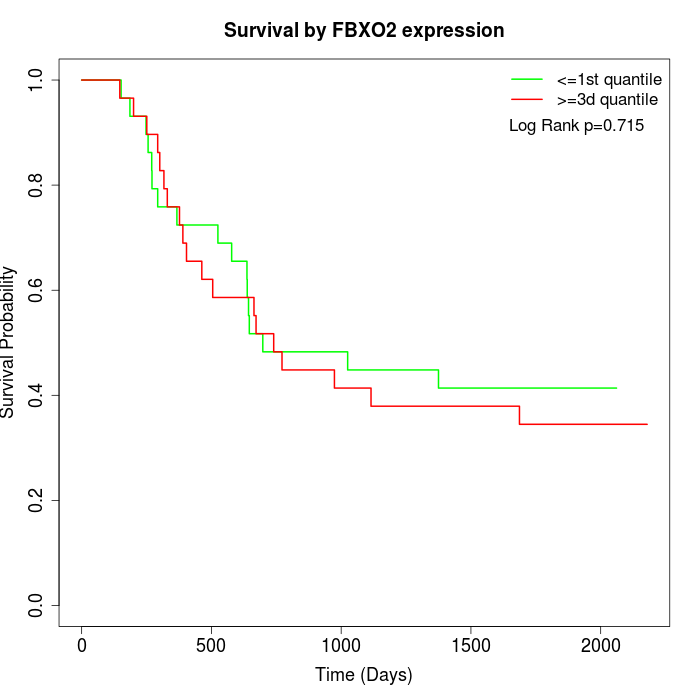 |  |
| GSE53622 | GSE53624 | TCGA |
Note: Click image to view full size file.
Copy number change of FBXO2:
| Dataset | Gene | EntrezID | Gain | Loss | Normal | Detail |
|---|---|---|---|---|---|---|
| GSE15526 | FBXO2 | 26232 | 0 | 5 | 25 | |
| GSE20123 | FBXO2 | 26232 | 0 | 4 | 26 | |
| GSE43470 | FBXO2 | 26232 | 5 | 5 | 33 | |
| GSE46452 | FBXO2 | 26232 | 7 | 1 | 51 | |
| GSE47630 | FBXO2 | 26232 | 8 | 4 | 28 | |
| GSE54993 | FBXO2 | 26232 | 3 | 1 | 66 | |
| GSE54994 | FBXO2 | 26232 | 11 | 4 | 38 | |
| GSE60625 | FBXO2 | 26232 | 0 | 0 | 11 | |
| GSE74703 | FBXO2 | 26232 | 4 | 3 | 29 | |
| GSE74704 | FBXO2 | 26232 | 0 | 0 | 20 | |
| TCGA | FBXO2 | 26232 | 10 | 23 | 63 |
Total number of gains: 48; Total number of losses: 50; Total Number of normals: 390.
Somatic mutations of FBXO2:
Generating mutation plots.
Highly correlated genes for FBXO2:
Showing top 20/112 corelated genes with mean PCC>0.5.
| Gene1 | Gene2 | Mean PCC | Num. Datasets | Num. PCC<0 | Num. PCC>0.5 |
|---|---|---|---|---|---|
| FBXO2 | RAP1GAP2 | 0.700812 | 3 | 0 | 3 |
| FBXO2 | TRIM46 | 0.68541 | 3 | 0 | 3 |
| FBXO2 | PABPC1L | 0.674439 | 3 | 0 | 3 |
| FBXO2 | COL9A3 | 0.653193 | 3 | 0 | 3 |
| FBXO2 | HTRA4 | 0.652878 | 3 | 0 | 3 |
| FBXO2 | WDR53 | 0.652369 | 3 | 0 | 3 |
| FBXO2 | MIB2 | 0.6521 | 4 | 0 | 3 |
| FBXO2 | TRABD | 0.650629 | 3 | 0 | 3 |
| FBXO2 | TDRD9 | 0.648782 | 4 | 0 | 4 |
| FBXO2 | FBXO44 | 0.638396 | 3 | 0 | 3 |
| FBXO2 | KLHDC4 | 0.635196 | 5 | 0 | 4 |
| FBXO2 | LHX6 | 0.633286 | 3 | 0 | 3 |
| FBXO2 | APOC2 | 0.62255 | 4 | 0 | 4 |
| FBXO2 | MROH1 | 0.621239 | 3 | 0 | 3 |
| FBXO2 | TCFL5 | 0.620506 | 3 | 0 | 3 |
| FBXO2 | CELSR3 | 0.618143 | 4 | 0 | 4 |
| FBXO2 | C4orf47 | 0.617468 | 5 | 0 | 4 |
| FBXO2 | TTC38 | 0.612049 | 3 | 0 | 3 |
| FBXO2 | LARP1 | 0.607231 | 4 | 0 | 3 |
| FBXO2 | EPHB2 | 0.605797 | 4 | 0 | 3 |
For details and further investigation, click here