| Full name: centrosomal protein 55 | Alias Symbol: FLJ10540|CT111 | ||
| Type: protein-coding gene | Cytoband: 10q23.33 | ||
| Entrez ID: 55165 | HGNC ID: HGNC:1161 | Ensembl Gene: ENSG00000138180 | OMIM ID: 610000 |
Screen Evidence:
| |||
Expression of CEP55:
| Dataset | Gene | EntrezID | Probe | Log2FC | Adj.pValue | Expression |
|---|---|---|---|---|---|---|
| GSE17351 | CEP55 | 55165 | 218542_at | 1.8193 | 0.0400 | |
| GSE20347 | CEP55 | 55165 | 218542_at | 2.0790 | 0.0000 | |
| GSE23400 | CEP55 | 55165 | 218542_at | 2.0649 | 0.0000 | |
| GSE26886 | CEP55 | 55165 | 218542_at | 0.3367 | 0.3792 | |
| GSE29001 | CEP55 | 55165 | 218542_at | 2.0757 | 0.0000 | |
| GSE38129 | CEP55 | 55165 | 218542_at | 2.5962 | 0.0000 | |
| GSE45670 | CEP55 | 55165 | 218542_at | 1.9967 | 0.0000 | |
| GSE53622 | CEP55 | 55165 | 2308 | 2.0121 | 0.0000 | |
| GSE53624 | CEP55 | 55165 | 2308 | 2.2077 | 0.0000 | |
| GSE63941 | CEP55 | 55165 | 218542_at | 2.4494 | 0.0020 | |
| GSE77861 | CEP55 | 55165 | 218542_at | 1.8829 | 0.0084 | |
| GSE97050 | CEP55 | 55165 | A_33_P3291831 | 2.7113 | 0.0717 | |
| SRP007169 | CEP55 | 55165 | RNAseq | 3.4260 | 0.0000 | |
| SRP008496 | CEP55 | 55165 | RNAseq | 3.2714 | 0.0000 | |
| SRP064894 | CEP55 | 55165 | RNAseq | 1.8130 | 0.0000 | |
| SRP133303 | CEP55 | 55165 | RNAseq | 2.4800 | 0.0000 | |
| SRP159526 | CEP55 | 55165 | RNAseq | 1.5575 | 0.0000 | |
| SRP193095 | CEP55 | 55165 | RNAseq | 1.5185 | 0.0000 | |
| SRP219564 | CEP55 | 55165 | RNAseq | 1.6669 | 0.0380 | |
| TCGA | CEP55 | 55165 | RNAseq | 1.2825 | 0.0000 |
Upregulated datasets: 18; Downregulated datasets: 0.
Survival by CEP55 expression:
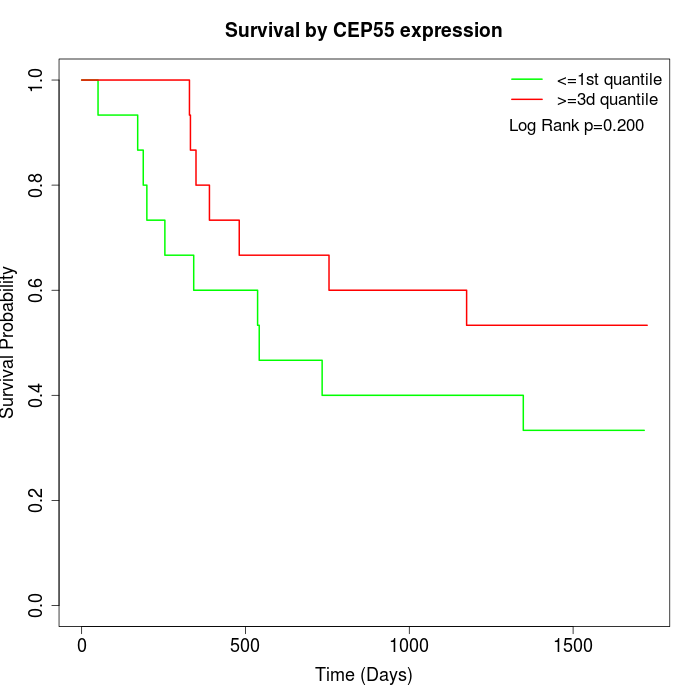 | 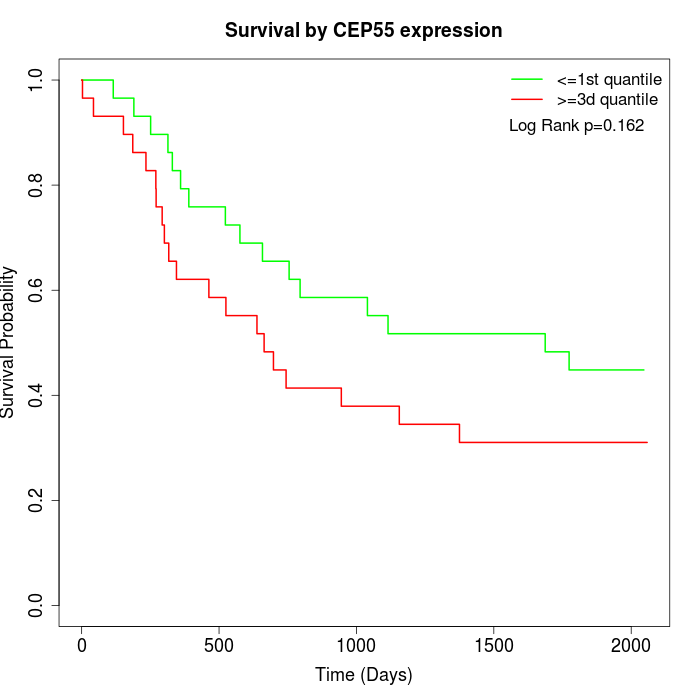 | 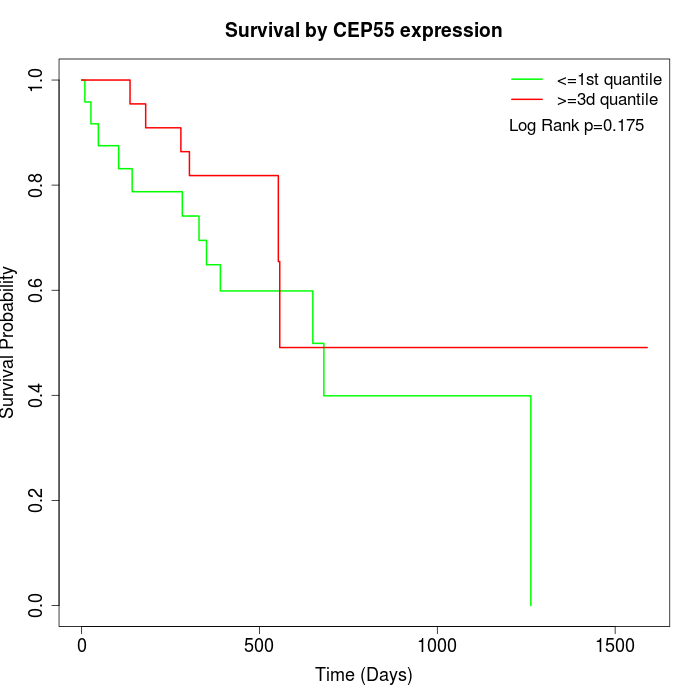 |
| GSE53622 | GSE53624 | TCGA |
Note: Click image to view full size file.
Copy number change of CEP55:
| Dataset | Gene | EntrezID | Gain | Loss | Normal | Detail |
|---|---|---|---|---|---|---|
| GSE15526 | CEP55 | 55165 | 0 | 8 | 22 | |
| GSE20123 | CEP55 | 55165 | 0 | 7 | 23 | |
| GSE43470 | CEP55 | 55165 | 0 | 7 | 36 | |
| GSE46452 | CEP55 | 55165 | 1 | 11 | 47 | |
| GSE47630 | CEP55 | 55165 | 2 | 14 | 24 | |
| GSE54993 | CEP55 | 55165 | 7 | 0 | 63 | |
| GSE54994 | CEP55 | 55165 | 1 | 10 | 42 | |
| GSE60625 | CEP55 | 55165 | 0 | 0 | 11 | |
| GSE74703 | CEP55 | 55165 | 0 | 5 | 31 | |
| GSE74704 | CEP55 | 55165 | 0 | 4 | 16 | |
| TCGA | CEP55 | 55165 | 6 | 26 | 64 |
Total number of gains: 17; Total number of losses: 92; Total Number of normals: 379.
Somatic mutations of CEP55:
Generating mutation plots.
Highly correlated genes for CEP55:
Showing top 20/2217 corelated genes with mean PCC>0.5.
| Gene1 | Gene2 | Mean PCC | Num. Datasets | Num. PCC<0 | Num. PCC>0.5 |
|---|---|---|---|---|---|
| CEP55 | CDK1 | 0.885762 | 12 | 0 | 12 |
| CEP55 | NEK2 | 0.86981 | 13 | 0 | 13 |
| CEP55 | KIF14 | 0.864841 | 13 | 0 | 12 |
| CEP55 | NCAPH | 0.859244 | 9 | 0 | 9 |
| CEP55 | PRC1 | 0.852982 | 13 | 0 | 13 |
| CEP55 | BUB1 | 0.850252 | 11 | 0 | 11 |
| CEP55 | KIF20A | 0.84913 | 13 | 0 | 13 |
| CEP55 | BUB1B | 0.846513 | 10 | 0 | 9 |
| CEP55 | KIF11 | 0.844458 | 13 | 0 | 13 |
| CEP55 | CCNB2 | 0.843913 | 12 | 0 | 12 |
| CEP55 | CDKN3 | 0.843425 | 13 | 0 | 13 |
| CEP55 | TOP2A | 0.842893 | 13 | 0 | 13 |
| CEP55 | UBE2C | 0.842311 | 13 | 0 | 13 |
| CEP55 | KIF23 | 0.84117 | 13 | 0 | 12 |
| CEP55 | TPX2 | 0.840623 | 13 | 0 | 12 |
| CEP55 | AURKB | 0.838318 | 13 | 0 | 13 |
| CEP55 | ASPM | 0.83577 | 13 | 0 | 12 |
| CEP55 | MKI67 | 0.833991 | 13 | 0 | 12 |
| CEP55 | MELK | 0.832102 | 13 | 0 | 12 |
| CEP55 | CDC20 | 0.830501 | 12 | 0 | 11 |
For details and further investigation, click here