| Full name: GTPase, IMAP family member 7 | Alias Symbol: MGC27027|IAN7 | ||
| Type: protein-coding gene | Cytoband: 7q36.1 | ||
| Entrez ID: 168537 | HGNC ID: HGNC:22404 | Ensembl Gene: ENSG00000179144 | OMIM ID: 616961 |
Expression of GIMAP7:
| Dataset | Gene | EntrezID | Probe | Log2FC | Adj.pValue | Expression |
|---|---|---|---|---|---|---|
| GSE17351 | GIMAP7 | 168537 | 228071_at | -0.5565 | 0.5458 | |
| GSE26886 | GIMAP7 | 168537 | 228071_at | -1.2652 | 0.0103 | |
| GSE45670 | GIMAP7 | 168537 | 228071_at | -1.4492 | 0.0027 | |
| GSE53622 | GIMAP7 | 168537 | 25366 | -1.0187 | 0.0000 | |
| GSE53624 | GIMAP7 | 168537 | 25366 | -1.0234 | 0.0000 | |
| GSE63941 | GIMAP7 | 168537 | 228071_at | 0.0121 | 0.9249 | |
| GSE77861 | GIMAP7 | 168537 | 228071_at | -0.0371 | 0.7943 | |
| GSE97050 | GIMAP7 | 168537 | A_24_P274831 | 0.2113 | 0.4879 | |
| SRP064894 | GIMAP7 | 168537 | RNAseq | -0.1255 | 0.7570 | |
| SRP133303 | GIMAP7 | 168537 | RNAseq | -1.1275 | 0.0006 | |
| SRP159526 | GIMAP7 | 168537 | RNAseq | -0.7607 | 0.1667 | |
| SRP193095 | GIMAP7 | 168537 | RNAseq | -0.4146 | 0.1301 | |
| SRP219564 | GIMAP7 | 168537 | RNAseq | -0.4291 | 0.3094 | |
| TCGA | GIMAP7 | 168537 | RNAseq | -0.6582 | 0.0002 |
Upregulated datasets: 0; Downregulated datasets: 5.
Survival by GIMAP7 expression:
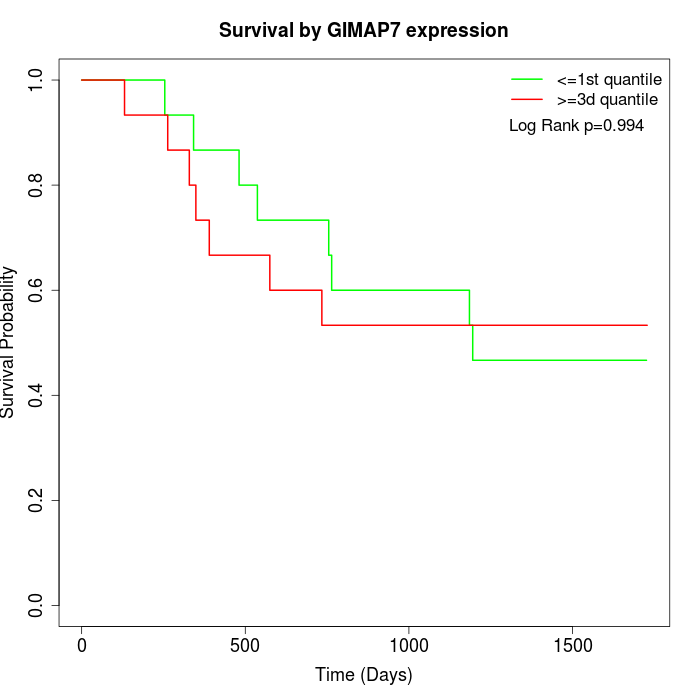 | 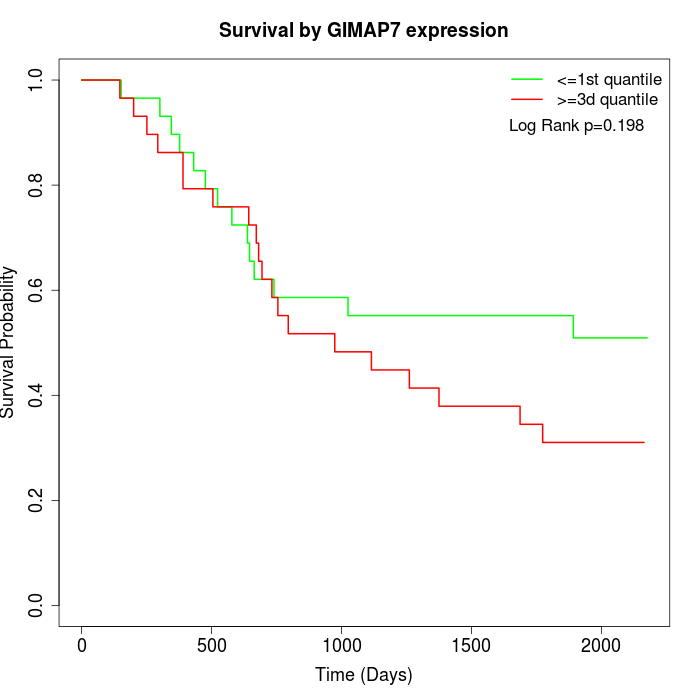 | 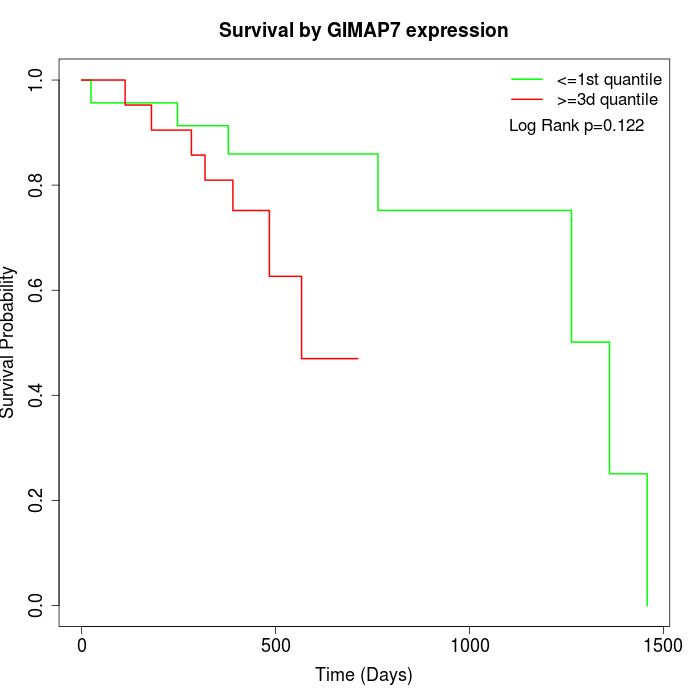 |
| GSE53622 | GSE53624 | TCGA |
Note: Click image to view full size file.
Copy number change of GIMAP7:
| Dataset | Gene | EntrezID | Gain | Loss | Normal | Detail |
|---|---|---|---|---|---|---|
| GSE15526 | GIMAP7 | 168537 | 2 | 4 | 24 | |
| GSE20123 | GIMAP7 | 168537 | 2 | 4 | 24 | |
| GSE43470 | GIMAP7 | 168537 | 2 | 5 | 36 | |
| GSE46452 | GIMAP7 | 168537 | 7 | 2 | 50 | |
| GSE47630 | GIMAP7 | 168537 | 6 | 8 | 26 | |
| GSE54993 | GIMAP7 | 168537 | 3 | 3 | 64 | |
| GSE54994 | GIMAP7 | 168537 | 7 | 8 | 38 | |
| GSE60625 | GIMAP7 | 168537 | 0 | 0 | 11 | |
| GSE74703 | GIMAP7 | 168537 | 2 | 4 | 30 | |
| GSE74704 | GIMAP7 | 168537 | 1 | 4 | 15 | |
| TCGA | GIMAP7 | 168537 | 26 | 27 | 43 |
Total number of gains: 58; Total number of losses: 69; Total Number of normals: 361.
Somatic mutations of GIMAP7:
Generating mutation plots.
Highly correlated genes for GIMAP7:
Showing top 20/823 corelated genes with mean PCC>0.5.
| Gene1 | Gene2 | Mean PCC | Num. Datasets | Num. PCC<0 | Num. PCC>0.5 |
|---|---|---|---|---|---|
| GIMAP7 | GIMAP5 | 0.870496 | 4 | 0 | 4 |
| GIMAP7 | SH3BP5 | 0.824508 | 3 | 0 | 3 |
| GIMAP7 | GIMAP6 | 0.817236 | 8 | 0 | 8 |
| GIMAP7 | DOCK10 | 0.805688 | 5 | 0 | 5 |
| GIMAP7 | ARHGAP15 | 0.802448 | 4 | 0 | 4 |
| GIMAP7 | FLI1 | 0.799911 | 7 | 0 | 7 |
| GIMAP7 | GIMAP8 | 0.79886 | 8 | 0 | 8 |
| GIMAP7 | CCR2 | 0.793061 | 6 | 0 | 6 |
| GIMAP7 | MPEG1 | 0.787559 | 6 | 0 | 6 |
| GIMAP7 | GIMAP4 | 0.787412 | 8 | 0 | 7 |
| GIMAP7 | XPNPEP2 | 0.783056 | 3 | 0 | 3 |
| GIMAP7 | IRF8 | 0.779726 | 7 | 0 | 7 |
| GIMAP7 | CLEC10A | 0.777946 | 5 | 0 | 5 |
| GIMAP7 | MAN1C1 | 0.77686 | 5 | 0 | 5 |
| GIMAP7 | TNFSF8 | 0.768662 | 4 | 0 | 4 |
| GIMAP7 | SLAMF6 | 0.768006 | 5 | 0 | 5 |
| GIMAP7 | PPP1R16B | 0.75996 | 5 | 0 | 5 |
| GIMAP7 | MS4A6A | 0.756719 | 7 | 0 | 7 |
| GIMAP7 | CEP44 | 0.751373 | 3 | 0 | 3 |
| GIMAP7 | CD53 | 0.750985 | 5 | 0 | 5 |
For details and further investigation, click here