| Full name: flotillin 1 | Alias Symbol: | ||
| Type: protein-coding gene | Cytoband: 6p21.33 | ||
| Entrez ID: 10211 | HGNC ID: HGNC:3757 | Ensembl Gene: ENSG00000137312 | OMIM ID: 606998 |
| Drug and gene relationship at DGIdb | |||
Expression of FLOT1:
| Dataset | Gene | EntrezID | Probe | Log2FC | Adj.pValue | Expression |
|---|---|---|---|---|---|---|
| GSE17351 | FLOT1 | 10211 | 208749_x_at | 0.2839 | 0.4290 | |
| GSE20347 | FLOT1 | 10211 | 210142_x_at | 0.2247 | 0.1107 | |
| GSE23400 | FLOT1 | 10211 | 208749_x_at | 0.3736 | 0.0000 | |
| GSE26886 | FLOT1 | 10211 | 210142_x_at | 0.3232 | 0.1046 | |
| GSE29001 | FLOT1 | 10211 | 210142_x_at | 0.1426 | 0.5726 | |
| GSE38129 | FLOT1 | 10211 | 208749_x_at | 0.3082 | 0.0464 | |
| GSE45670 | FLOT1 | 10211 | 210142_x_at | 0.0951 | 0.5770 | |
| GSE53622 | FLOT1 | 10211 | 44520 | 0.3689 | 0.0000 | |
| GSE53624 | FLOT1 | 10211 | 44520 | 0.1780 | 0.0001 | |
| GSE63941 | FLOT1 | 10211 | 210142_x_at | 0.3048 | 0.4330 | |
| GSE77861 | FLOT1 | 10211 | 208749_x_at | 0.3394 | 0.1865 | |
| GSE97050 | FLOT1 | 10211 | A_23_P214603 | 0.2519 | 0.2684 | |
| SRP007169 | FLOT1 | 10211 | RNAseq | 0.3245 | 0.3920 | |
| SRP008496 | FLOT1 | 10211 | RNAseq | 0.3944 | 0.1027 | |
| SRP064894 | FLOT1 | 10211 | RNAseq | 0.7451 | 0.0012 | |
| SRP133303 | FLOT1 | 10211 | RNAseq | 0.2838 | 0.0245 | |
| SRP159526 | FLOT1 | 10211 | RNAseq | 0.5567 | 0.0123 | |
| SRP193095 | FLOT1 | 10211 | RNAseq | 0.3782 | 0.0007 | |
| SRP219564 | FLOT1 | 10211 | RNAseq | 0.0920 | 0.8353 | |
| TCGA | FLOT1 | 10211 | RNAseq | 0.0216 | 0.6279 |
Upregulated datasets: 0; Downregulated datasets: 0.
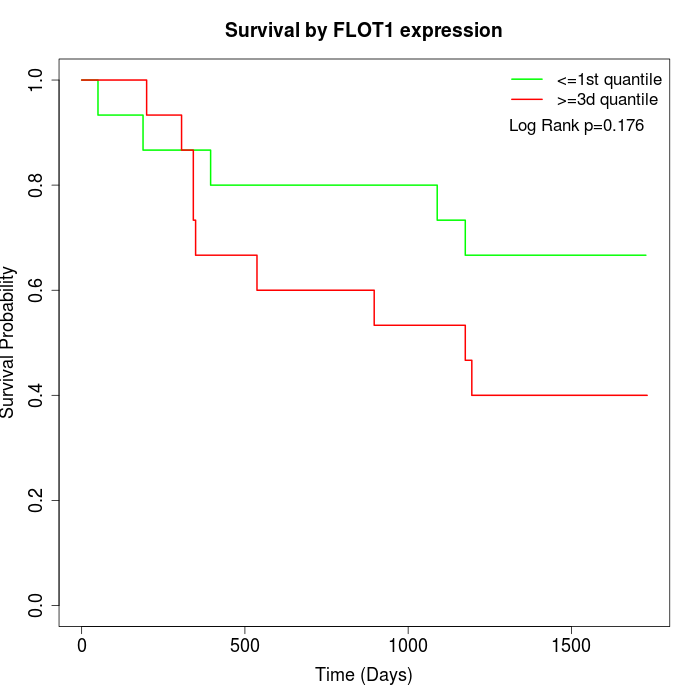
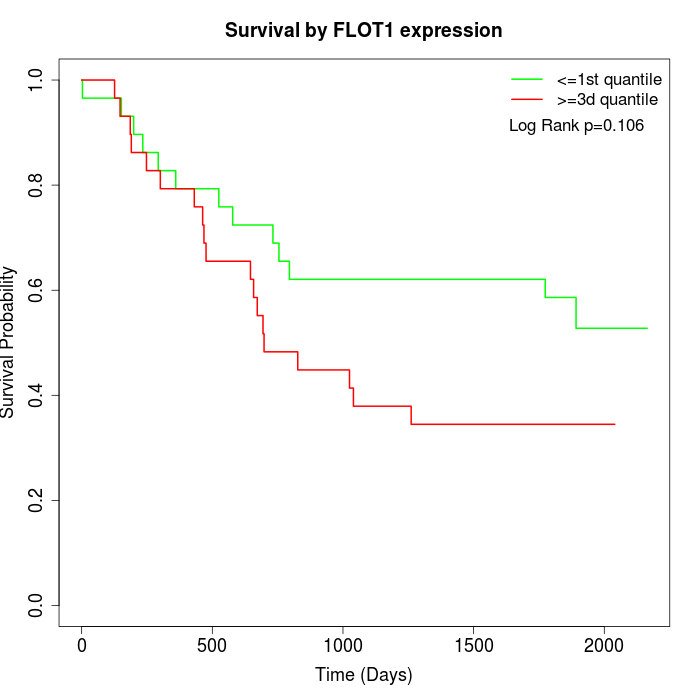
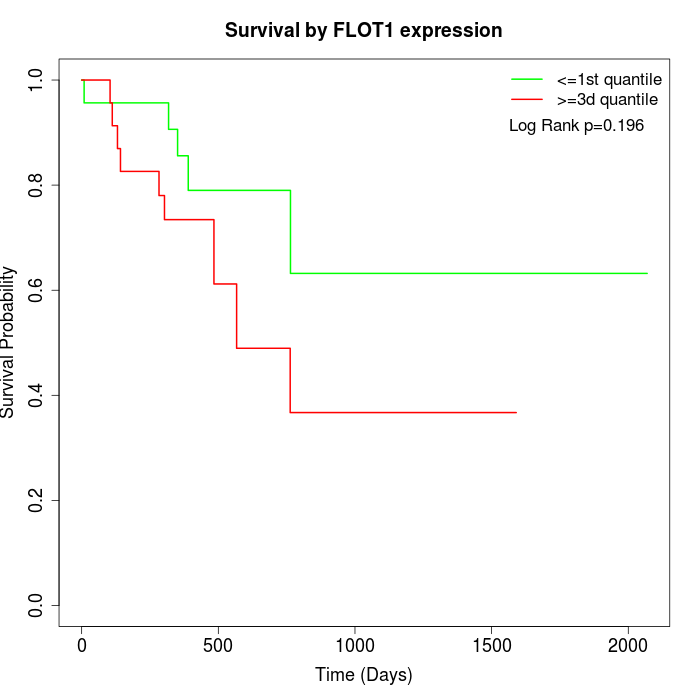
Survival by FLOT1 expression:
Note: Click image to view full size file.
Copy number change of FLOT1:
| Dataset | Gene | EntrezID | Gain | Loss | Normal | Detail |
|---|---|---|---|---|---|---|
| GSE15526 | FLOT1 | 10211 | 5 | 1 | 24 | |
| GSE20123 | FLOT1 | 10211 | 5 | 1 | 24 | |
| GSE43470 | FLOT1 | 10211 | 5 | 1 | 37 | |
| GSE46452 | FLOT1 | 10211 | 1 | 10 | 48 | |
| GSE47630 | FLOT1 | 10211 | 7 | 3 | 30 | |
| GSE54993 | FLOT1 | 10211 | 2 | 1 | 67 | |
| GSE54994 | FLOT1 | 10211 | 11 | 4 | 38 | |
| GSE60625 | FLOT1 | 10211 | 0 | 1 | 10 | |
| GSE74703 | FLOT1 | 10211 | 5 | 0 | 31 | |
| GSE74704 | FLOT1 | 10211 | 2 | 0 | 18 | |
| TCGA | FLOT1 | 10211 | 18 | 16 | 62 |
Total number of gains: 61; Total number of losses: 38; Total Number of normals: 389.
Somatic mutations of FLOT1:
Generating mutation plots.
Highly correlated genes for FLOT1:
Showing top 20/322 corelated genes with mean PCC>0.5.
| Gene1 | Gene2 | Mean PCC | Num. Datasets | Num. PCC<0 | Num. PCC>0.5 |
|---|---|---|---|---|---|
| FLOT1 | ZDHHC4 | 0.676354 | 3 | 0 | 3 |
| FLOT1 | RAD51D | 0.671978 | 4 | 0 | 4 |
| FLOT1 | CASC15 | 0.646119 | 3 | 0 | 3 |
| FLOT1 | ASTN2 | 0.642716 | 3 | 0 | 3 |
| FLOT1 | GLI2 | 0.64196 | 4 | 0 | 4 |
| FLOT1 | GJA4 | 0.640399 | 5 | 0 | 4 |
| FLOT1 | SIRPB2 | 0.640239 | 3 | 0 | 3 |
| FLOT1 | ABL1 | 0.637242 | 5 | 0 | 4 |
| FLOT1 | CABYR | 0.627758 | 3 | 0 | 3 |
| FLOT1 | FKRP | 0.624364 | 4 | 0 | 3 |
| FLOT1 | AGPAT1 | 0.61919 | 8 | 0 | 6 |
| FLOT1 | IFITM2 | 0.618182 | 7 | 0 | 6 |
| FLOT1 | GRAMD1A | 0.617248 | 5 | 0 | 4 |
| FLOT1 | SMPDL3B | 0.614031 | 4 | 0 | 3 |
| FLOT1 | GALNT2 | 0.61298 | 6 | 0 | 5 |
| FLOT1 | ATRAID | 0.60194 | 4 | 0 | 3 |
| FLOT1 | HMG20B | 0.60129 | 7 | 0 | 7 |
| FLOT1 | FMNL1 | 0.601241 | 4 | 0 | 3 |
| FLOT1 | ELOVL5 | 0.599341 | 4 | 0 | 4 |
| FLOT1 | TSPAN18 | 0.597763 | 3 | 0 | 3 |
For details and further investigation, click here


