| Full name: DEP domain containing 1 | Alias Symbol: DEP.8|FLJ20354|SDP35|DEPDC1A | ||
| Type: protein-coding gene | Cytoband: 1p31.3 | ||
| Entrez ID: 55635 | HGNC ID: HGNC:22949 | Ensembl Gene: ENSG00000024526 | OMIM ID: 612002 |
Expression of DEPDC1:
| Dataset | Gene | EntrezID | Probe | Log2FC | Adj.pValue | Expression |
|---|---|---|---|---|---|---|
| GSE17351 | DEPDC1 | 55635 | 222958_s_at | 1.6831 | 0.0171 | |
| GSE20347 | DEPDC1 | 55635 | 220295_x_at | 0.8269 | 0.0002 | |
| GSE23400 | DEPDC1 | 55635 | 220295_x_at | 0.4170 | 0.0000 | |
| GSE26886 | DEPDC1 | 55635 | 222958_s_at | 0.0659 | 0.8979 | |
| GSE29001 | DEPDC1 | 55635 | 220295_x_at | 0.9007 | 0.0838 | |
| GSE38129 | DEPDC1 | 55635 | 220295_x_at | 1.1581 | 0.0000 | |
| GSE45670 | DEPDC1 | 55635 | 222958_s_at | 1.8946 | 0.0000 | |
| GSE53622 | DEPDC1 | 55635 | 5943 | 1.2123 | 0.0000 | |
| GSE53624 | DEPDC1 | 55635 | 5943 | 1.3490 | 0.0000 | |
| GSE63941 | DEPDC1 | 55635 | 222958_s_at | 3.4538 | 0.0003 | |
| GSE77861 | DEPDC1 | 55635 | 235545_at | 0.2660 | 0.4317 | |
| GSE97050 | DEPDC1 | 55635 | A_23_P200310 | 1.0277 | 0.1581 | |
| SRP007169 | DEPDC1 | 55635 | RNAseq | 1.7323 | 0.0023 | |
| SRP008496 | DEPDC1 | 55635 | RNAseq | 0.9614 | 0.0114 | |
| SRP064894 | DEPDC1 | 55635 | RNAseq | 1.7041 | 0.0000 | |
| SRP133303 | DEPDC1 | 55635 | RNAseq | 1.6046 | 0.0000 | |
| SRP159526 | DEPDC1 | 55635 | RNAseq | 0.9504 | 0.0546 | |
| SRP193095 | DEPDC1 | 55635 | RNAseq | 0.5723 | 0.0019 | |
| SRP219564 | DEPDC1 | 55635 | RNAseq | 1.1062 | 0.1774 | |
| TCGA | DEPDC1 | 55635 | RNAseq | 1.2623 | 0.0000 |
Upregulated datasets: 10; Downregulated datasets: 0.
Survival by DEPDC1 expression:
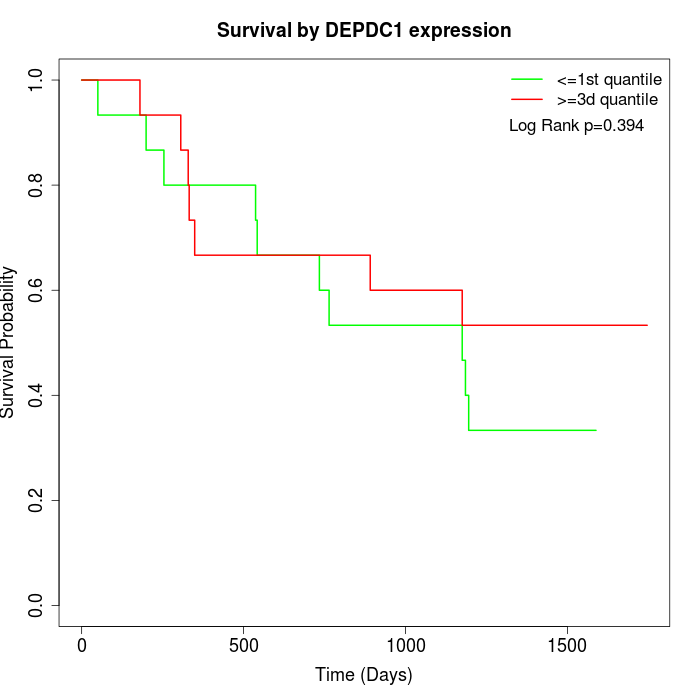 | 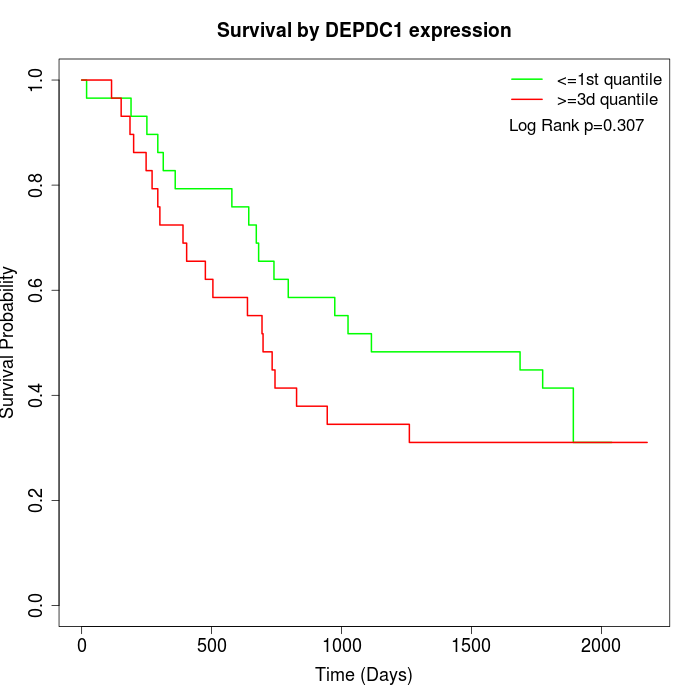 | 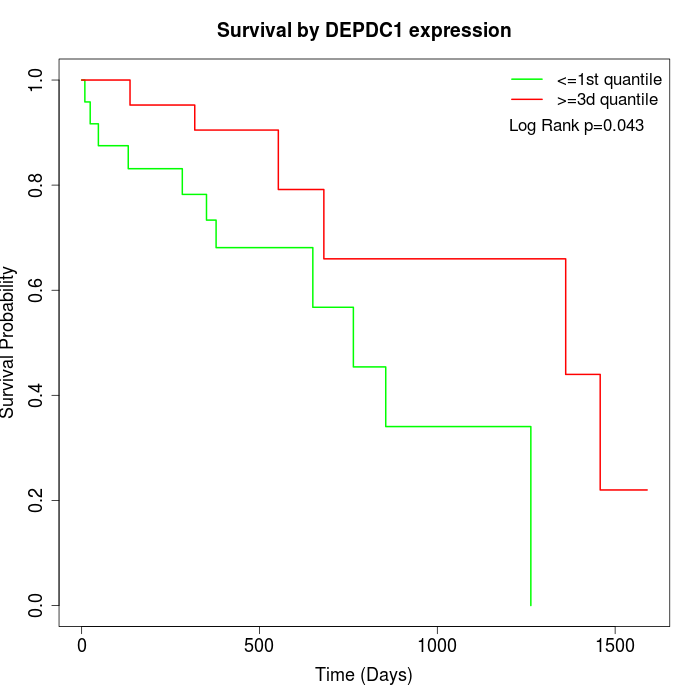 |
| GSE53622 | GSE53624 | TCGA |
Note: Click image to view full size file.
Copy number change of DEPDC1:
| Dataset | Gene | EntrezID | Gain | Loss | Normal | Detail |
|---|---|---|---|---|---|---|
| GSE15526 | DEPDC1 | 55635 | 2 | 6 | 22 | |
| GSE20123 | DEPDC1 | 55635 | 2 | 5 | 23 | |
| GSE43470 | DEPDC1 | 55635 | 4 | 4 | 35 | |
| GSE46452 | DEPDC1 | 55635 | 0 | 1 | 58 | |
| GSE47630 | DEPDC1 | 55635 | 7 | 6 | 27 | |
| GSE54993 | DEPDC1 | 55635 | 0 | 0 | 70 | |
| GSE54994 | DEPDC1 | 55635 | 6 | 4 | 43 | |
| GSE60625 | DEPDC1 | 55635 | 0 | 0 | 11 | |
| GSE74703 | DEPDC1 | 55635 | 3 | 3 | 30 | |
| GSE74704 | DEPDC1 | 55635 | 1 | 2 | 17 | |
| TCGA | DEPDC1 | 55635 | 8 | 22 | 66 |
Total number of gains: 33; Total number of losses: 53; Total Number of normals: 402.
Somatic mutations of DEPDC1:
Generating mutation plots.
Highly correlated genes for DEPDC1:
Showing top 20/1579 corelated genes with mean PCC>0.5.
| Gene1 | Gene2 | Mean PCC | Num. Datasets | Num. PCC<0 | Num. PCC>0.5 |
|---|---|---|---|---|---|
| DEPDC1 | TTK | 0.806011 | 13 | 0 | 12 |
| DEPDC1 | UBE2T | 0.79916 | 8 | 0 | 7 |
| DEPDC1 | HMMR | 0.797951 | 13 | 0 | 13 |
| DEPDC1 | CDCA2 | 0.788074 | 7 | 0 | 7 |
| DEPDC1 | BUB1 | 0.786869 | 11 | 0 | 11 |
| DEPDC1 | KIF15 | 0.785758 | 12 | 0 | 12 |
| DEPDC1 | MMS22L | 0.785047 | 3 | 0 | 3 |
| DEPDC1 | ANLN | 0.78418 | 9 | 0 | 9 |
| DEPDC1 | CENPE | 0.7839 | 13 | 0 | 13 |
| DEPDC1 | INTS10 | 0.778178 | 3 | 0 | 3 |
| DEPDC1 | CDK1 | 0.773269 | 12 | 0 | 12 |
| DEPDC1 | NUF2 | 0.772879 | 9 | 0 | 9 |
| DEPDC1 | NEK2 | 0.772579 | 13 | 0 | 13 |
| DEPDC1 | ASPM | 0.771175 | 13 | 0 | 12 |
| DEPDC1 | KIF23 | 0.770873 | 13 | 0 | 12 |
| DEPDC1 | CCNA2 | 0.766302 | 13 | 0 | 13 |
| DEPDC1 | CEP55 | 0.766178 | 13 | 0 | 13 |
| DEPDC1 | ATAD2 | 0.765913 | 13 | 0 | 13 |
| DEPDC1 | KIF14 | 0.762331 | 13 | 0 | 12 |
| DEPDC1 | RACGAP1 | 0.760276 | 11 | 0 | 11 |
For details and further investigation, click here