| Full name: glucose-fructose oxidoreductase domain containing 1 | Alias Symbol: FLJ20330|ADG-90 | ||
| Type: protein-coding gene | Cytoband: 6p24.1-p23 | ||
| Entrez ID: 54438 | HGNC ID: HGNC:21096 | Ensembl Gene: ENSG00000145990 | OMIM ID: |
Expression of GFOD1:
| Dataset | Gene | EntrezID | Probe | Log2FC | Adj.pValue | Expression |
|---|---|---|---|---|---|---|
| GSE17351 | GFOD1 | 54438 | 219821_s_at | 0.1411 | 0.6394 | |
| GSE20347 | GFOD1 | 54438 | 219821_s_at | -0.0958 | 0.6806 | |
| GSE23400 | GFOD1 | 54438 | 219821_s_at | -0.2334 | 0.0008 | |
| GSE26886 | GFOD1 | 54438 | 219821_s_at | -0.1901 | 0.4161 | |
| GSE29001 | GFOD1 | 54438 | 219821_s_at | -0.3497 | 0.3365 | |
| GSE38129 | GFOD1 | 54438 | 219821_s_at | -0.1473 | 0.4567 | |
| GSE45670 | GFOD1 | 54438 | 219821_s_at | 0.1463 | 0.5414 | |
| GSE53622 | GFOD1 | 54438 | 112903 | -0.5681 | 0.0000 | |
| GSE53624 | GFOD1 | 54438 | 112903 | -0.2440 | 0.0147 | |
| GSE63941 | GFOD1 | 54438 | 219821_s_at | 0.8326 | 0.1490 | |
| GSE77861 | GFOD1 | 54438 | 219821_s_at | 0.1492 | 0.5063 | |
| GSE97050 | GFOD1 | 54438 | A_23_P122662 | -0.3249 | 0.2382 | |
| SRP007169 | GFOD1 | 54438 | RNAseq | -0.1497 | 0.7289 | |
| SRP008496 | GFOD1 | 54438 | RNAseq | 0.0997 | 0.7900 | |
| SRP064894 | GFOD1 | 54438 | RNAseq | 0.0243 | 0.9066 | |
| SRP133303 | GFOD1 | 54438 | RNAseq | -0.4200 | 0.0472 | |
| SRP159526 | GFOD1 | 54438 | RNAseq | -0.7095 | 0.0214 | |
| SRP193095 | GFOD1 | 54438 | RNAseq | 0.1973 | 0.2887 | |
| SRP219564 | GFOD1 | 54438 | RNAseq | -0.7250 | 0.1029 | |
| TCGA | GFOD1 | 54438 | RNAseq | 0.0336 | 0.7585 |
Upregulated datasets: 0; Downregulated datasets: 0.
Survival by GFOD1 expression:
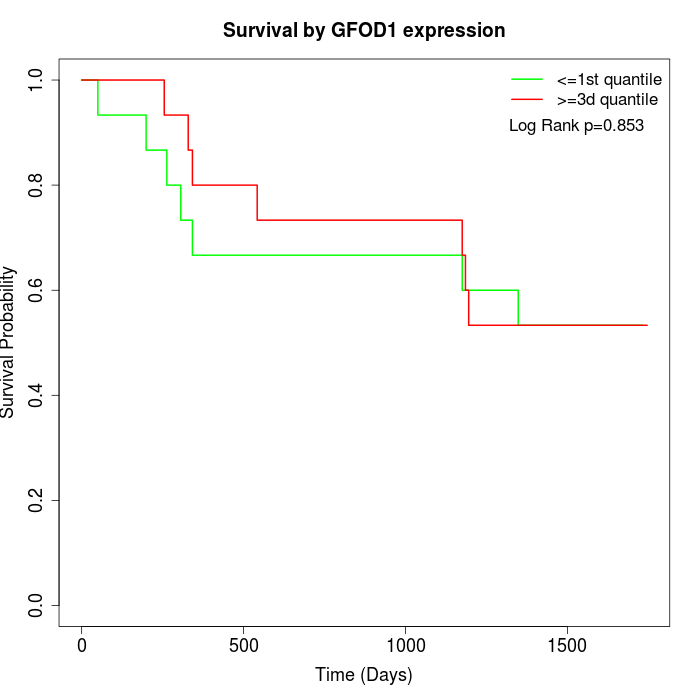 |  |  |
| GSE53622 | GSE53624 | TCGA |
Note: Click image to view full size file.
Copy number change of GFOD1:
| Dataset | Gene | EntrezID | Gain | Loss | Normal | Detail |
|---|---|---|---|---|---|---|
| GSE15526 | GFOD1 | 54438 | 3 | 7 | 20 | |
| GSE20123 | GFOD1 | 54438 | 3 | 7 | 20 | |
| GSE43470 | GFOD1 | 54438 | 8 | 0 | 35 | |
| GSE46452 | GFOD1 | 54438 | 1 | 10 | 48 | |
| GSE47630 | GFOD1 | 54438 | 7 | 8 | 25 | |
| GSE54993 | GFOD1 | 54438 | 1 | 1 | 68 | |
| GSE54994 | GFOD1 | 54438 | 10 | 3 | 40 | |
| GSE60625 | GFOD1 | 54438 | 0 | 1 | 10 | |
| GSE74703 | GFOD1 | 54438 | 7 | 0 | 29 | |
| GSE74704 | GFOD1 | 54438 | 2 | 3 | 15 | |
| TCGA | GFOD1 | 54438 | 16 | 26 | 54 |
Total number of gains: 58; Total number of losses: 66; Total Number of normals: 364.
Somatic mutations of GFOD1:
Generating mutation plots.
Highly correlated genes for GFOD1:
Showing top 20/124 corelated genes with mean PCC>0.5.
| Gene1 | Gene2 | Mean PCC | Num. Datasets | Num. PCC<0 | Num. PCC>0.5 |
|---|---|---|---|---|---|
| GFOD1 | GEMIN5 | 0.707252 | 3 | 0 | 3 |
| GFOD1 | STK38 | 0.68914 | 3 | 0 | 3 |
| GFOD1 | OPHN1 | 0.688509 | 3 | 0 | 3 |
| GFOD1 | CNOT2 | 0.685798 | 3 | 0 | 3 |
| GFOD1 | EIF4A3 | 0.681311 | 3 | 0 | 3 |
| GFOD1 | AP4E1 | 0.671628 | 4 | 0 | 3 |
| GFOD1 | MAP2K3 | 0.671177 | 3 | 0 | 3 |
| GFOD1 | XRN1 | 0.668262 | 3 | 0 | 3 |
| GFOD1 | ABHD4 | 0.659925 | 3 | 0 | 3 |
| GFOD1 | TRIM65 | 0.658406 | 3 | 0 | 3 |
| GFOD1 | HTATIP2 | 0.657608 | 3 | 0 | 3 |
| GFOD1 | ZBTB7A | 0.657321 | 5 | 0 | 3 |
| GFOD1 | BICD2 | 0.63895 | 7 | 0 | 5 |
| GFOD1 | FAM83G | 0.635405 | 5 | 0 | 4 |
| GFOD1 | TKT | 0.622024 | 4 | 0 | 3 |
| GFOD1 | MAP3K5 | 0.621021 | 4 | 0 | 3 |
| GFOD1 | COQ10B | 0.618266 | 4 | 0 | 3 |
| GFOD1 | FLNB | 0.614757 | 5 | 0 | 3 |
| GFOD1 | BIRC6 | 0.609231 | 4 | 0 | 3 |
| GFOD1 | ZFC3H1 | 0.606989 | 4 | 0 | 3 |
For details and further investigation, click here