| Full name: HIV-1 Tat interactive protein 2 | Alias Symbol: TIP30|CC3|FLJ26963|SDR44U1 | ||
| Type: protein-coding gene | Cytoband: 11p15.1 | ||
| Entrez ID: 10553 | HGNC ID: HGNC:16637 | Ensembl Gene: ENSG00000109854 | OMIM ID: 605628 |
Expression of HTATIP2:
| Dataset | Gene | EntrezID | Probe | Log2FC | Adj.pValue | Expression |
|---|---|---|---|---|---|---|
| GSE17351 | HTATIP2 | 10553 | 209448_at | 0.4730 | 0.4425 | |
| GSE20347 | HTATIP2 | 10553 | 209448_at | 0.1206 | 0.6339 | |
| GSE23400 | HTATIP2 | 10553 | 209448_at | 0.5644 | 0.0000 | |
| GSE26886 | HTATIP2 | 10553 | 209448_at | 0.1125 | 0.5586 | |
| GSE29001 | HTATIP2 | 10553 | 209448_at | 0.4457 | 0.1335 | |
| GSE38129 | HTATIP2 | 10553 | 209448_at | 0.5386 | 0.0095 | |
| GSE45670 | HTATIP2 | 10553 | 209448_at | 0.6389 | 0.0025 | |
| GSE53622 | HTATIP2 | 10553 | 35013 | 0.6999 | 0.0000 | |
| GSE53624 | HTATIP2 | 10553 | 35013 | 0.7015 | 0.0000 | |
| GSE63941 | HTATIP2 | 10553 | 209448_at | 0.4783 | 0.7535 | |
| GSE77861 | HTATIP2 | 10553 | 209448_at | 0.3843 | 0.3845 | |
| GSE97050 | HTATIP2 | 10553 | A_23_P64129 | 0.9864 | 0.1158 | |
| SRP007169 | HTATIP2 | 10553 | RNAseq | 0.4824 | 0.2273 | |
| SRP008496 | HTATIP2 | 10553 | RNAseq | 0.7282 | 0.0064 | |
| SRP064894 | HTATIP2 | 10553 | RNAseq | 0.7419 | 0.0057 | |
| SRP133303 | HTATIP2 | 10553 | RNAseq | 1.2678 | 0.0002 | |
| SRP159526 | HTATIP2 | 10553 | RNAseq | 0.2831 | 0.5774 | |
| SRP193095 | HTATIP2 | 10553 | RNAseq | -0.2990 | 0.1684 | |
| SRP219564 | HTATIP2 | 10553 | RNAseq | 0.8487 | 0.0757 | |
| TCGA | HTATIP2 | 10553 | RNAseq | 0.2477 | 0.0118 |
Upregulated datasets: 1; Downregulated datasets: 0.
Survival by HTATIP2 expression:
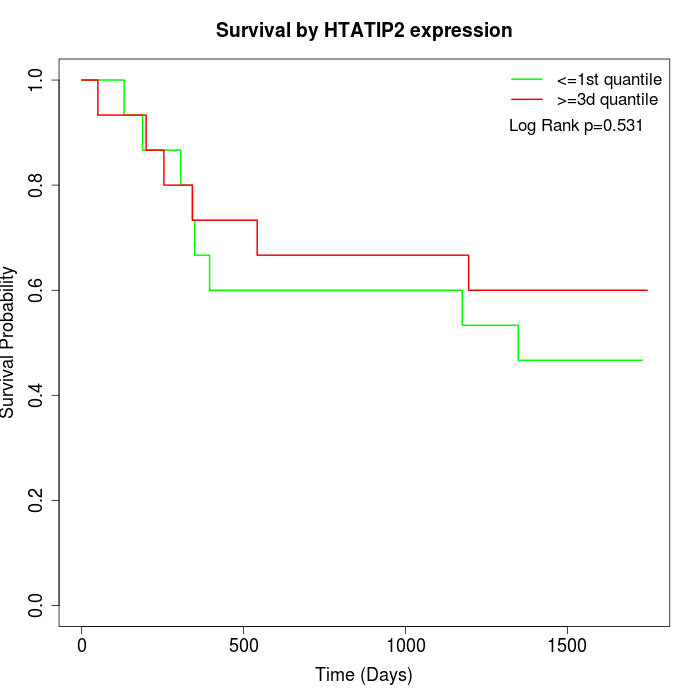 | 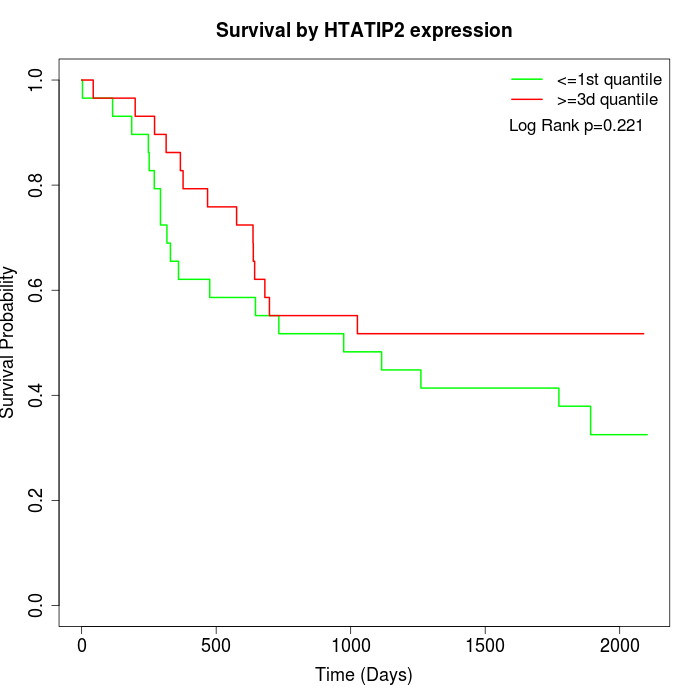 | 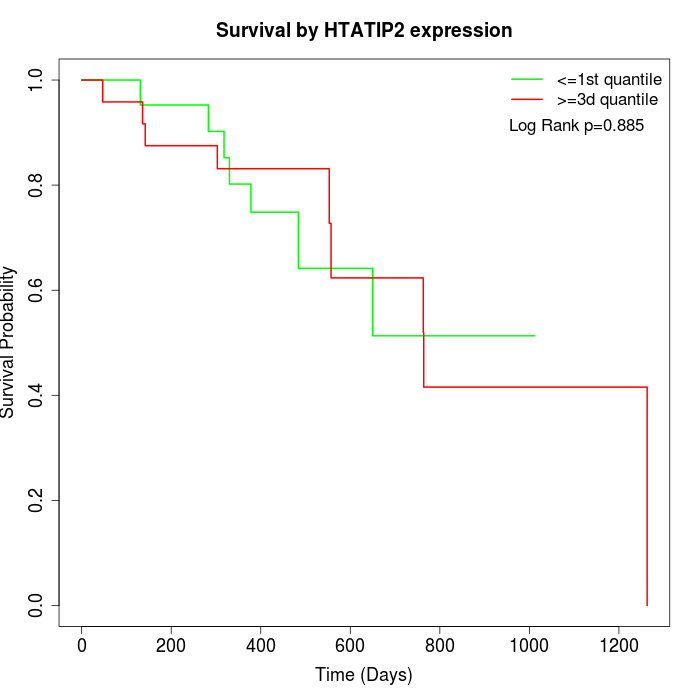 |
| GSE53622 | GSE53624 | TCGA |
Note: Click image to view full size file.
Copy number change of HTATIP2:
| Dataset | Gene | EntrezID | Gain | Loss | Normal | Detail |
|---|---|---|---|---|---|---|
| GSE15526 | HTATIP2 | 10553 | 0 | 9 | 21 | |
| GSE20123 | HTATIP2 | 10553 | 0 | 10 | 20 | |
| GSE43470 | HTATIP2 | 10553 | 1 | 5 | 37 | |
| GSE46452 | HTATIP2 | 10553 | 7 | 5 | 47 | |
| GSE47630 | HTATIP2 | 10553 | 3 | 10 | 27 | |
| GSE54993 | HTATIP2 | 10553 | 3 | 0 | 67 | |
| GSE54994 | HTATIP2 | 10553 | 3 | 12 | 38 | |
| GSE60625 | HTATIP2 | 10553 | 0 | 0 | 11 | |
| GSE74703 | HTATIP2 | 10553 | 1 | 3 | 32 | |
| GSE74704 | HTATIP2 | 10553 | 0 | 8 | 12 | |
| TCGA | HTATIP2 | 10553 | 13 | 26 | 57 |
Total number of gains: 31; Total number of losses: 88; Total Number of normals: 369.
Somatic mutations of HTATIP2:
Generating mutation plots.
Highly correlated genes for HTATIP2:
Showing top 20/842 corelated genes with mean PCC>0.5.
| Gene1 | Gene2 | Mean PCC | Num. Datasets | Num. PCC<0 | Num. PCC>0.5 |
|---|---|---|---|---|---|
| HTATIP2 | DKC1 | 0.740348 | 3 | 0 | 3 |
| HTATIP2 | DENND1B | 0.71691 | 3 | 0 | 3 |
| HTATIP2 | NLN | 0.706071 | 4 | 0 | 4 |
| HTATIP2 | FAM83B | 0.704992 | 4 | 0 | 4 |
| HTATIP2 | TSPAN17 | 0.704619 | 4 | 0 | 4 |
| HTATIP2 | TFAP2A | 0.702762 | 5 | 0 | 4 |
| HTATIP2 | SRXN1 | 0.685446 | 5 | 0 | 5 |
| HTATIP2 | FRMD8 | 0.68506 | 4 | 0 | 3 |
| HTATIP2 | SLC25A39 | 0.684215 | 3 | 0 | 3 |
| HTATIP2 | PNPO | 0.683967 | 4 | 0 | 4 |
| HTATIP2 | EME1 | 0.680001 | 3 | 0 | 3 |
| HTATIP2 | ARMCX5 | 0.670726 | 4 | 0 | 4 |
| HTATIP2 | DCAF13 | 0.669242 | 5 | 0 | 5 |
| HTATIP2 | GFM2 | 0.668092 | 3 | 0 | 3 |
| HTATIP2 | ELF1 | 0.6656 | 3 | 0 | 3 |
| HTATIP2 | RABIF | 0.662585 | 4 | 0 | 4 |
| HTATIP2 | RNF149 | 0.657888 | 6 | 0 | 4 |
| HTATIP2 | GFOD1 | 0.657608 | 3 | 0 | 3 |
| HTATIP2 | MRPL50 | 0.649331 | 5 | 0 | 4 |
| HTATIP2 | DUSP18 | 0.647534 | 3 | 0 | 3 |
For details and further investigation, click here