| Full name: glycoprotein integral membrane 1 | Alias Symbol: dJ12G14.2 | ||
| Type: protein-coding gene | Cytoband: 6q25.1 | ||
| Entrez ID: 116254 | HGNC ID: HGNC:21074 | Ensembl Gene: ENSG00000055211 | OMIM ID: |
Expression of GINM1:
| Dataset | Gene | EntrezID | Probe | Log2FC | Adj.pValue | Expression |
|---|---|---|---|---|---|---|
| GSE17351 | GINM1 | 116254 | 225576_at | -0.4352 | 0.2472 | |
| GSE26886 | GINM1 | 116254 | 225576_at | -0.5173 | 0.0014 | |
| GSE45670 | GINM1 | 116254 | 225576_at | -0.4914 | 0.0005 | |
| GSE53622 | GINM1 | 116254 | 4856 | 0.0556 | 0.2995 | |
| GSE53624 | GINM1 | 116254 | 4856 | 0.0087 | 0.8861 | |
| GSE63941 | GINM1 | 116254 | 225576_at | -1.2136 | 0.0007 | |
| GSE77861 | GINM1 | 116254 | 225576_at | 0.0281 | 0.9018 | |
| SRP007169 | GINM1 | 116254 | RNAseq | -0.6336 | 0.0477 | |
| SRP008496 | GINM1 | 116254 | RNAseq | -0.3024 | 0.1952 | |
| SRP064894 | GINM1 | 116254 | RNAseq | -0.0348 | 0.8384 | |
| SRP133303 | GINM1 | 116254 | RNAseq | 0.0295 | 0.8605 | |
| SRP159526 | GINM1 | 116254 | RNAseq | -0.0320 | 0.8736 | |
| SRP193095 | GINM1 | 116254 | RNAseq | -0.2412 | 0.0517 | |
| SRP219564 | GINM1 | 116254 | RNAseq | -0.2996 | 0.4431 |
Upregulated datasets: 0; Downregulated datasets: 1.
Survival by GINM1 expression:
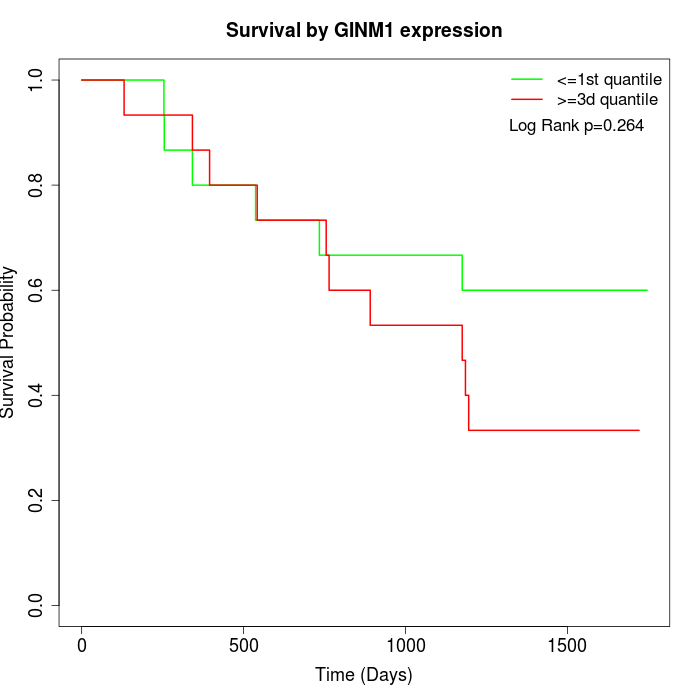 | 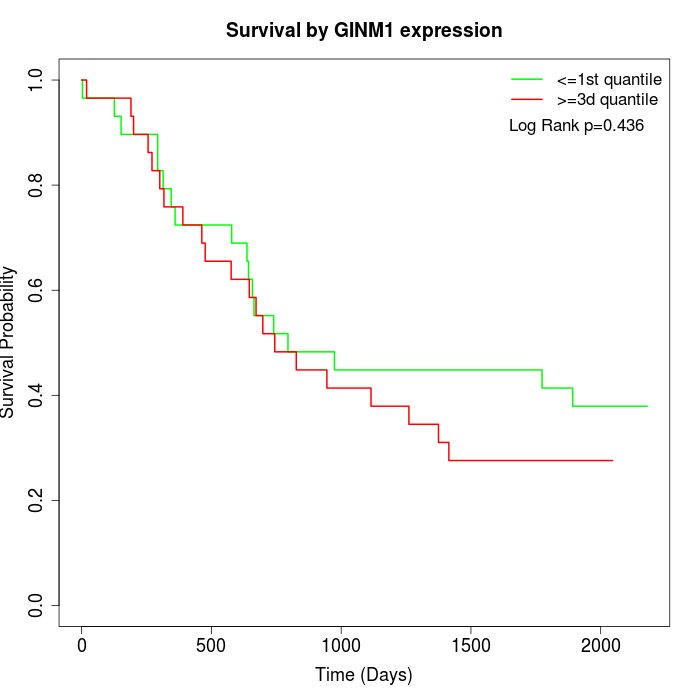 |
| GSE53622 | GSE53624 |
Note: Click image to view full size file.
Copy number change of GINM1:
| Dataset | Gene | EntrezID | Gain | Loss | Normal | Detail |
|---|---|---|---|---|---|---|
| GSE15526 | GINM1 | 116254 | 2 | 4 | 24 | |
| GSE20123 | GINM1 | 116254 | 1 | 3 | 26 | |
| GSE43470 | GINM1 | 116254 | 4 | 0 | 39 | |
| GSE46452 | GINM1 | 116254 | 3 | 10 | 46 | |
| GSE47630 | GINM1 | 116254 | 9 | 4 | 27 | |
| GSE54993 | GINM1 | 116254 | 3 | 2 | 65 | |
| GSE54994 | GINM1 | 116254 | 8 | 8 | 37 | |
| GSE60625 | GINM1 | 116254 | 0 | 1 | 10 | |
| GSE74703 | GINM1 | 116254 | 4 | 0 | 32 | |
| GSE74704 | GINM1 | 116254 | 0 | 1 | 19 | |
| TCGA | GINM1 | 116254 | 11 | 21 | 64 |
Total number of gains: 45; Total number of losses: 54; Total Number of normals: 389.
Somatic mutations of GINM1:
Generating mutation plots.
Highly correlated genes for GINM1:
Showing top 20/75 corelated genes with mean PCC>0.5.
| Gene1 | Gene2 | Mean PCC | Num. Datasets | Num. PCC<0 | Num. PCC>0.5 |
|---|---|---|---|---|---|
| GINM1 | TMEM159 | 0.688247 | 3 | 0 | 3 |
| GINM1 | CPEB2 | 0.687827 | 3 | 0 | 3 |
| GINM1 | RASSF1 | 0.660073 | 3 | 0 | 3 |
| GINM1 | PPIL4 | 0.653828 | 3 | 0 | 3 |
| GINM1 | SACM1L | 0.647936 | 3 | 0 | 3 |
| GINM1 | SLMAP | 0.642958 | 3 | 0 | 3 |
| GINM1 | EXOC2 | 0.624101 | 4 | 0 | 4 |
| GINM1 | CLIP1 | 0.618712 | 3 | 0 | 3 |
| GINM1 | RAB14 | 0.615177 | 4 | 0 | 3 |
| GINM1 | PGM3 | 0.614247 | 3 | 0 | 3 |
| GINM1 | DPT | 0.609017 | 3 | 0 | 3 |
| GINM1 | CNRIP1 | 0.603176 | 3 | 0 | 3 |
| GINM1 | SUCLA2 | 0.600675 | 3 | 0 | 3 |
| GINM1 | YIPF5 | 0.600299 | 3 | 0 | 3 |
| GINM1 | SLC30A9 | 0.599632 | 5 | 0 | 3 |
| GINM1 | PTPN21 | 0.597873 | 4 | 0 | 4 |
| GINM1 | C6orf120 | 0.596384 | 3 | 0 | 3 |
| GINM1 | PRKAR1A | 0.589588 | 3 | 0 | 3 |
| GINM1 | SYNC | 0.586065 | 3 | 0 | 3 |
| GINM1 | FYCO1 | 0.584102 | 4 | 0 | 3 |
For details and further investigation, click here