| Full name: gliomedin | Alias Symbol: CRG-L2|CLOM|colmedin|UNC-112 | ||
| Type: protein-coding gene | Cytoband: 15q21.2 | ||
| Entrez ID: 342035 | HGNC ID: HGNC:29514 | Ensembl Gene: ENSG00000186417 | OMIM ID: 608603 |
Expression of GLDN:
| Dataset | Gene | EntrezID | Probe | Log2FC | Adj.pValue | Expression |
|---|---|---|---|---|---|---|
| GSE17351 | GLDN | 342035 | 230360_at | 0.6462 | 0.4094 | |
| GSE26886 | GLDN | 342035 | 232649_at | 0.2879 | 0.0215 | |
| GSE45670 | GLDN | 342035 | 232649_at | 0.0526 | 0.5803 | |
| GSE53622 | GLDN | 342035 | 87555 | -0.4182 | 0.0109 | |
| GSE53624 | GLDN | 342035 | 87555 | 0.2499 | 0.0838 | |
| GSE63941 | GLDN | 342035 | 232649_at | -0.2501 | 0.1783 | |
| GSE77861 | GLDN | 342035 | 232649_at | -0.0729 | 0.4607 | |
| GSE97050 | GLDN | 342035 | A_24_P49199 | -0.2248 | 0.6479 | |
| SRP007169 | GLDN | 342035 | RNAseq | 0.8680 | 0.2693 | |
| SRP064894 | GLDN | 342035 | RNAseq | 1.3668 | 0.0012 | |
| SRP133303 | GLDN | 342035 | RNAseq | 0.8752 | 0.0307 | |
| SRP159526 | GLDN | 342035 | RNAseq | -0.7139 | 0.1138 | |
| SRP193095 | GLDN | 342035 | RNAseq | 0.5005 | 0.0549 | |
| SRP219564 | GLDN | 342035 | RNAseq | 0.7272 | 0.2131 | |
| TCGA | GLDN | 342035 | RNAseq | -0.2287 | 0.2466 |
Upregulated datasets: 1; Downregulated datasets: 0.
Survival by GLDN expression:
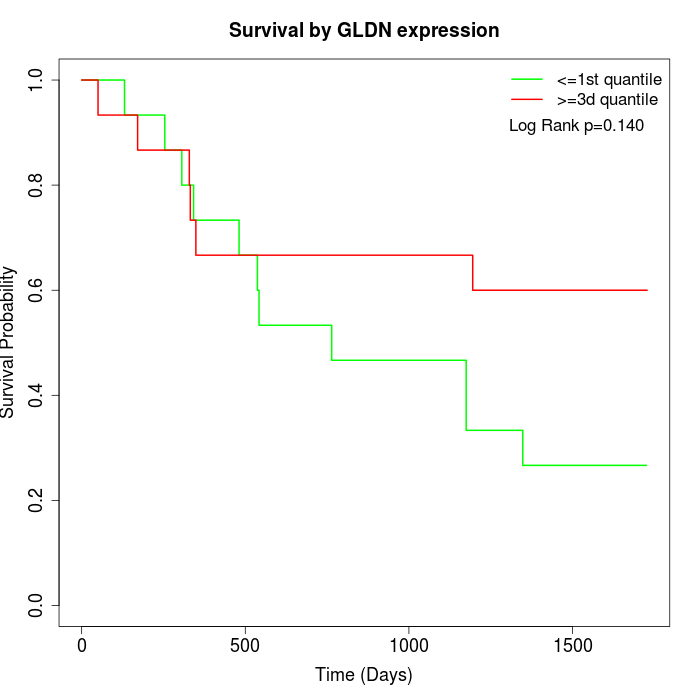 | 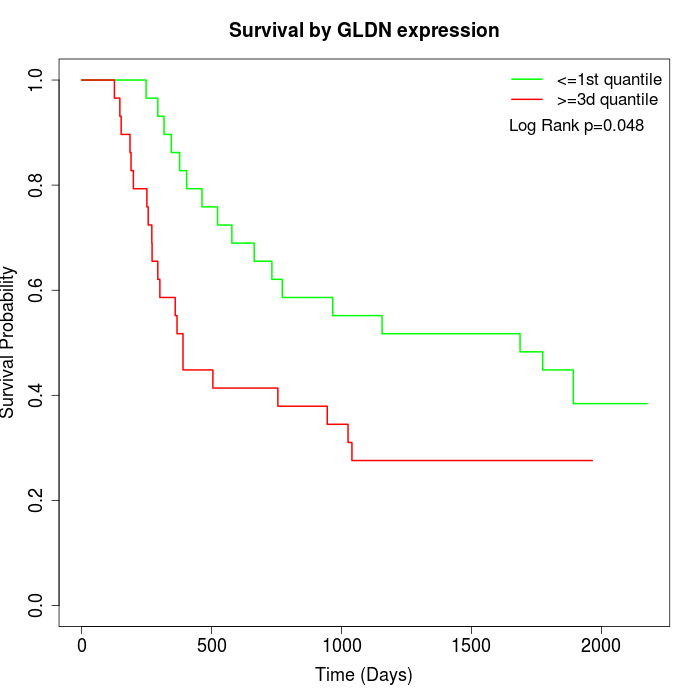 | 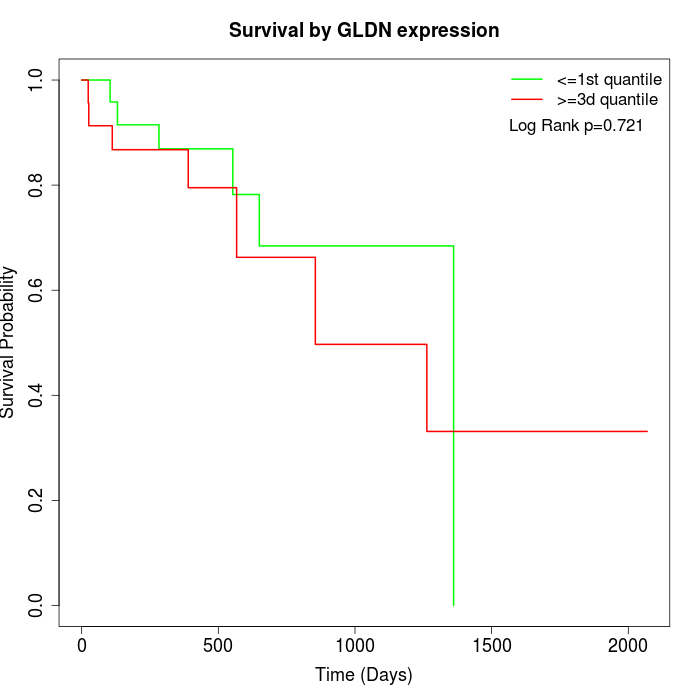 |
| GSE53622 | GSE53624 | TCGA |
Note: Click image to view full size file.
Copy number change of GLDN:
| Dataset | Gene | EntrezID | Gain | Loss | Normal | Detail |
|---|---|---|---|---|---|---|
| GSE15526 | GLDN | 342035 | 5 | 3 | 22 | |
| GSE20123 | GLDN | 342035 | 5 | 3 | 22 | |
| GSE43470 | GLDN | 342035 | 5 | 3 | 35 | |
| GSE46452 | GLDN | 342035 | 3 | 7 | 49 | |
| GSE47630 | GLDN | 342035 | 8 | 10 | 22 | |
| GSE54993 | GLDN | 342035 | 4 | 6 | 60 | |
| GSE54994 | GLDN | 342035 | 5 | 7 | 41 | |
| GSE60625 | GLDN | 342035 | 4 | 0 | 7 | |
| GSE74703 | GLDN | 342035 | 5 | 2 | 29 | |
| GSE74704 | GLDN | 342035 | 2 | 3 | 15 | |
| TCGA | GLDN | 342035 | 9 | 18 | 69 |
Total number of gains: 55; Total number of losses: 62; Total Number of normals: 371.
Somatic mutations of GLDN:
Generating mutation plots.
Highly correlated genes for GLDN:
Showing top 20/46 corelated genes with mean PCC>0.5.
| Gene1 | Gene2 | Mean PCC | Num. Datasets | Num. PCC<0 | Num. PCC>0.5 |
|---|---|---|---|---|---|
| GLDN | GAS6-AS1 | 0.690144 | 3 | 0 | 3 |
| GLDN | FRS3 | 0.682726 | 3 | 0 | 3 |
| GLDN | CDK20 | 0.678337 | 3 | 0 | 3 |
| GLDN | TCF15 | 0.666529 | 3 | 0 | 3 |
| GLDN | LINC00880 | 0.645319 | 3 | 0 | 3 |
| GLDN | CACNA1H | 0.634857 | 3 | 0 | 3 |
| GLDN | ABHD16B | 0.627392 | 3 | 0 | 3 |
| GLDN | ATF5 | 0.627238 | 3 | 0 | 3 |
| GLDN | HTRA3 | 0.621068 | 3 | 0 | 3 |
| GLDN | CTXN1 | 0.61735 | 3 | 0 | 3 |
| GLDN | OGG1 | 0.615243 | 3 | 0 | 3 |
| GLDN | C9orf50 | 0.612168 | 3 | 0 | 3 |
| GLDN | COL19A1 | 0.608826 | 5 | 0 | 3 |
| GLDN | IP6K1 | 0.607645 | 3 | 0 | 3 |
| GLDN | PTP4A3 | 0.605904 | 4 | 0 | 3 |
| GLDN | C2CD4B | 0.588775 | 3 | 0 | 3 |
| GLDN | CLCF1 | 0.585608 | 3 | 0 | 3 |
| GLDN | RAB3A | 0.58452 | 3 | 0 | 3 |
| GLDN | LENG1 | 0.584468 | 3 | 0 | 3 |
| GLDN | TFEB | 0.584014 | 4 | 0 | 3 |
For details and further investigation, click here