| Full name: G protein subunit alpha transducin 2 | Alias Symbol: ACHM4 | ||
| Type: protein-coding gene | Cytoband: 1p13.3 | ||
| Entrez ID: 2780 | HGNC ID: HGNC:4394 | Ensembl Gene: ENSG00000134183 | OMIM ID: 139340 |
Expression of GNAT2:
| Dataset | Gene | EntrezID | Probe | Log2FC | Adj.pValue | Expression |
|---|---|---|---|---|---|---|
| GSE17351 | GNAT2 | 2780 | 210604_at | 0.0134 | 0.9746 | |
| GSE20347 | GNAT2 | 2780 | 210604_at | 0.0575 | 0.3460 | |
| GSE23400 | GNAT2 | 2780 | 210604_at | -0.1758 | 0.0000 | |
| GSE26886 | GNAT2 | 2780 | 210604_at | 0.0059 | 0.9680 | |
| GSE29001 | GNAT2 | 2780 | 210604_at | -0.1593 | 0.2000 | |
| GSE38129 | GNAT2 | 2780 | 210604_at | -0.0057 | 0.9266 | |
| GSE45670 | GNAT2 | 2780 | 210604_at | -0.1687 | 0.0565 | |
| GSE63941 | GNAT2 | 2780 | 210604_at | 0.2975 | 0.1449 | |
| GSE77861 | GNAT2 | 2780 | 210604_at | -0.1106 | 0.2736 | |
| GSE97050 | GNAT2 | 2780 | A_33_P3409944 | -0.3038 | 0.1883 | |
| SRP133303 | GNAT2 | 2780 | RNAseq | -0.7569 | 0.0062 | |
| SRP193095 | GNAT2 | 2780 | RNAseq | -0.7071 | 0.0008 | |
| TCGA | GNAT2 | 2780 | RNAseq | -0.3265 | 0.3818 |
Upregulated datasets: 0; Downregulated datasets: 0.
Survival by GNAT2 expression:
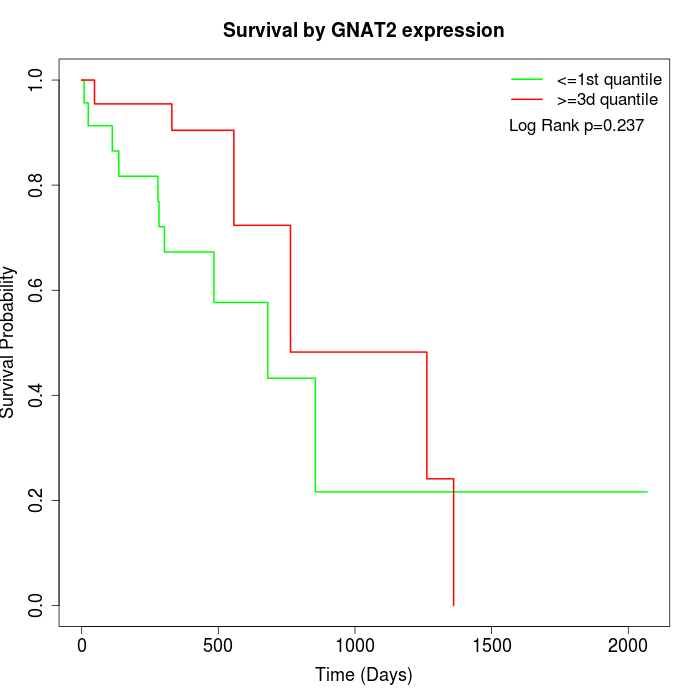 |
| TCGA |
Note: Click image to view full size file.
Copy number change of GNAT2:
| Dataset | Gene | EntrezID | Gain | Loss | Normal | Detail |
|---|---|---|---|---|---|---|
| GSE15526 | GNAT2 | 2780 | 0 | 12 | 18 | |
| GSE20123 | GNAT2 | 2780 | 0 | 11 | 19 | |
| GSE43470 | GNAT2 | 2780 | 0 | 9 | 34 | |
| GSE46452 | GNAT2 | 2780 | 2 | 1 | 56 | |
| GSE47630 | GNAT2 | 2780 | 9 | 5 | 26 | |
| GSE54993 | GNAT2 | 2780 | 0 | 1 | 69 | |
| GSE54994 | GNAT2 | 2780 | 7 | 4 | 42 | |
| GSE60625 | GNAT2 | 2780 | 0 | 0 | 11 | |
| GSE74703 | GNAT2 | 2780 | 0 | 7 | 29 | |
| GSE74704 | GNAT2 | 2780 | 0 | 7 | 13 | |
| TCGA | GNAT2 | 2780 | 9 | 26 | 61 |
Total number of gains: 27; Total number of losses: 83; Total Number of normals: 378.
Somatic mutations of GNAT2:
Generating mutation plots.
Highly correlated genes for GNAT2:
Showing top 20/314 corelated genes with mean PCC>0.5.
| Gene1 | Gene2 | Mean PCC | Num. Datasets | Num. PCC<0 | Num. PCC>0.5 |
|---|---|---|---|---|---|
| GNAT2 | ZNF717 | 0.773071 | 3 | 0 | 3 |
| GNAT2 | CCIN | 0.722442 | 3 | 0 | 3 |
| GNAT2 | TIRAP | 0.712753 | 3 | 0 | 3 |
| GNAT2 | NMNAT2 | 0.707138 | 5 | 0 | 4 |
| GNAT2 | AGL | 0.706781 | 3 | 0 | 3 |
| GNAT2 | JPH3 | 0.692077 | 3 | 0 | 3 |
| GNAT2 | BTRC | 0.689828 | 3 | 0 | 3 |
| GNAT2 | LSS | 0.689439 | 3 | 0 | 3 |
| GNAT2 | CNTF | 0.689268 | 3 | 0 | 3 |
| GNAT2 | BLVRA | 0.685111 | 3 | 0 | 3 |
| GNAT2 | CAB39L | 0.678019 | 3 | 0 | 3 |
| GNAT2 | CER1 | 0.675373 | 4 | 0 | 4 |
| GNAT2 | ADCYAP1 | 0.674649 | 3 | 0 | 3 |
| GNAT2 | EPS15L1 | 0.672668 | 3 | 0 | 3 |
| GNAT2 | IFNA7 | 0.670522 | 4 | 0 | 4 |
| GNAT2 | CRYBG3 | 0.670179 | 3 | 0 | 3 |
| GNAT2 | CYP1A2 | 0.666537 | 4 | 0 | 4 |
| GNAT2 | CLC | 0.663182 | 3 | 0 | 3 |
| GNAT2 | UTF1 | 0.663096 | 4 | 0 | 4 |
| GNAT2 | RAB11FIP3 | 0.662163 | 3 | 0 | 3 |
For details and further investigation, click here