| Full name: immunoglobulin like domain containing receptor 2 | Alias Symbol: | ||
| Type: protein-coding gene | Cytoband: 1q24.1 | ||
| Entrez ID: 387597 | HGNC ID: HGNC:18131 | Ensembl Gene: ENSG00000143195 | OMIM ID: 618081 |
Expression of ILDR2:
| Dataset | Gene | EntrezID | Probe | Log2FC | Adj.pValue | Expression |
|---|---|---|---|---|---|---|
| GSE17351 | ILDR2 | 387597 | 229380_at | 0.0828 | 0.9258 | |
| GSE26886 | ILDR2 | 387597 | 229380_at | 0.8098 | 0.0177 | |
| GSE45670 | ILDR2 | 387597 | 229380_at | -0.0848 | 0.5018 | |
| GSE53622 | ILDR2 | 387597 | 445 | 0.4640 | 0.0068 | |
| GSE53624 | ILDR2 | 387597 | 445 | 0.2854 | 0.0052 | |
| GSE63941 | ILDR2 | 387597 | 229380_at | 0.4212 | 0.3075 | |
| GSE77861 | ILDR2 | 387597 | 229380_at | -0.0157 | 0.8891 | |
| GSE97050 | ILDR2 | 387597 | A_33_P3328317 | -0.5256 | 0.2185 | |
| SRP064894 | ILDR2 | 387597 | RNAseq | 0.6162 | 0.0158 | |
| SRP133303 | ILDR2 | 387597 | RNAseq | 1.0251 | 0.0001 | |
| SRP159526 | ILDR2 | 387597 | RNAseq | 0.7103 | 0.2198 | |
| SRP193095 | ILDR2 | 387597 | RNAseq | 0.6279 | 0.0026 | |
| SRP219564 | ILDR2 | 387597 | RNAseq | -0.7745 | 0.2812 | |
| TCGA | ILDR2 | 387597 | RNAseq | -0.4100 | 0.4184 |
Upregulated datasets: 1; Downregulated datasets: 0.
Survival by ILDR2 expression:
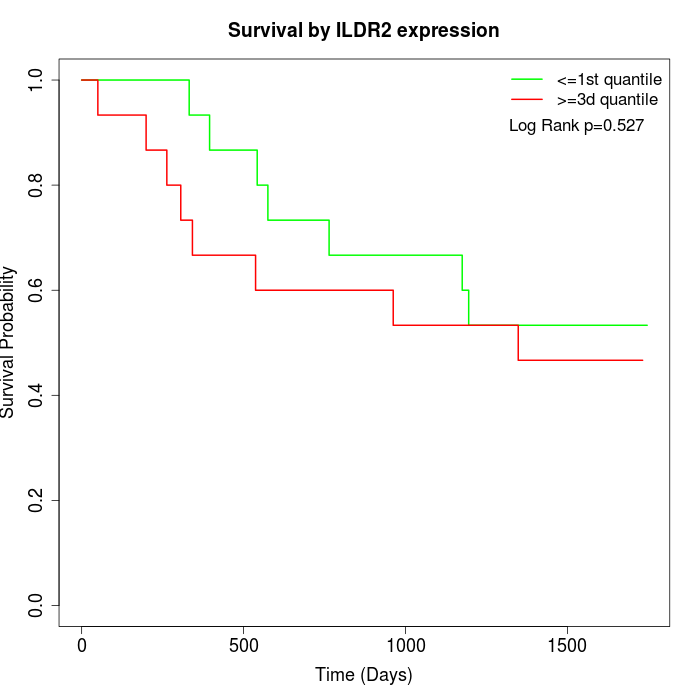 | 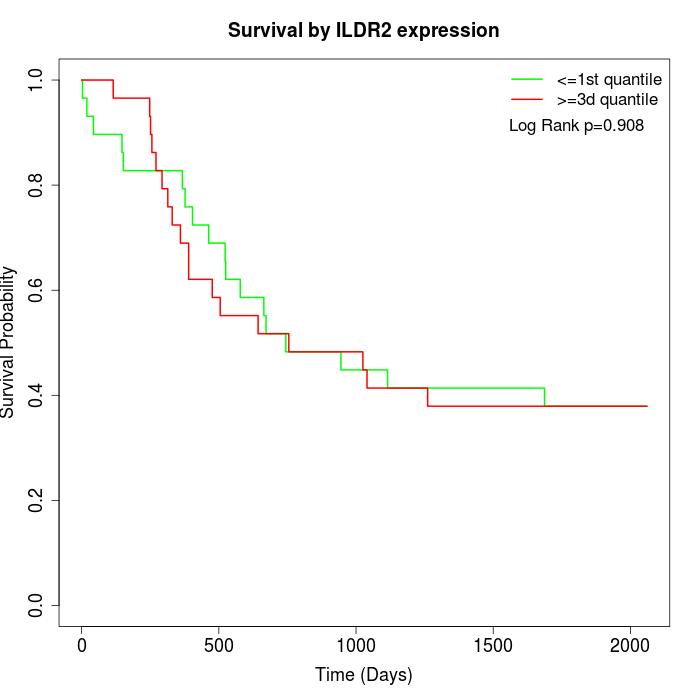 | 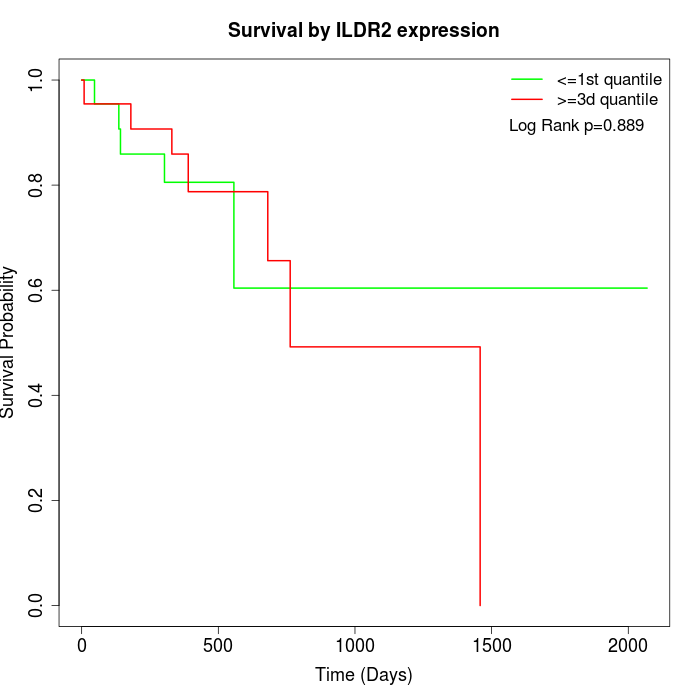 |
| GSE53622 | GSE53624 | TCGA |
Note: Click image to view full size file.
Copy number change of ILDR2:
| Dataset | Gene | EntrezID | Gain | Loss | Normal | Detail |
|---|---|---|---|---|---|---|
| GSE15526 | ILDR2 | 387597 | 11 | 1 | 18 | |
| GSE20123 | ILDR2 | 387597 | 11 | 1 | 18 | |
| GSE43470 | ILDR2 | 387597 | 7 | 2 | 34 | |
| GSE46452 | ILDR2 | 387597 | 2 | 1 | 56 | |
| GSE47630 | ILDR2 | 387597 | 14 | 0 | 26 | |
| GSE54993 | ILDR2 | 387597 | 0 | 5 | 65 | |
| GSE54994 | ILDR2 | 387597 | 16 | 0 | 37 | |
| GSE60625 | ILDR2 | 387597 | 0 | 0 | 11 | |
| GSE74703 | ILDR2 | 387597 | 7 | 2 | 27 | |
| GSE74704 | ILDR2 | 387597 | 5 | 0 | 15 | |
| TCGA | ILDR2 | 387597 | 44 | 3 | 49 |
Total number of gains: 117; Total number of losses: 15; Total Number of normals: 356.
Somatic mutations of ILDR2:
Generating mutation plots.
Highly correlated genes for ILDR2:
Showing top 20/240 corelated genes with mean PCC>0.5.
| Gene1 | Gene2 | Mean PCC | Num. Datasets | Num. PCC<0 | Num. PCC>0.5 |
|---|---|---|---|---|---|
| ILDR2 | PGR | 0.816748 | 3 | 0 | 3 |
| ILDR2 | ANKS3 | 0.798993 | 3 | 0 | 3 |
| ILDR2 | BRINP3 | 0.775752 | 3 | 0 | 3 |
| ILDR2 | EPHA7 | 0.766836 | 3 | 0 | 3 |
| ILDR2 | PPP1R9A | 0.763483 | 3 | 0 | 3 |
| ILDR2 | CYP2U1 | 0.762277 | 3 | 0 | 3 |
| ILDR2 | NAALADL2 | 0.754003 | 3 | 0 | 3 |
| ILDR2 | NLGN1 | 0.743572 | 4 | 0 | 4 |
| ILDR2 | WFS1 | 0.737938 | 3 | 0 | 3 |
| ILDR2 | NRXN3 | 0.737121 | 3 | 0 | 3 |
| ILDR2 | SPATA6 | 0.732521 | 3 | 0 | 3 |
| ILDR2 | LNP1 | 0.732462 | 4 | 0 | 4 |
| ILDR2 | COL28A1 | 0.719892 | 3 | 0 | 3 |
| ILDR2 | TOX | 0.719604 | 3 | 0 | 3 |
| ILDR2 | ARNT2 | 0.717218 | 4 | 0 | 4 |
| ILDR2 | CILP2 | 0.71614 | 3 | 0 | 3 |
| ILDR2 | TTC33 | 0.71048 | 4 | 0 | 3 |
| ILDR2 | PLEKHO1 | 0.709471 | 3 | 0 | 3 |
| ILDR2 | RIC8B | 0.707984 | 3 | 0 | 3 |
| ILDR2 | CAMTA1 | 0.706507 | 3 | 0 | 3 |
For details and further investigation, click here