| Full name: MIS18 kinetochore protein A | Alias Symbol: B28|FASP1|hMis18alpha | ||
| Type: protein-coding gene | Cytoband: 21q22.11 | ||
| Entrez ID: 54069 | HGNC ID: HGNC:1286 | Ensembl Gene: ENSG00000159055 | OMIM ID: 618137 |
| Drug and gene relationship at DGIdb | |||
Screen Evidence:
| |||
Expression of MIS18A:
| Dataset | Gene | EntrezID | Probe | Log2FC | Adj.pValue | Expression |
|---|---|---|---|---|---|---|
| GSE17351 | MIS18A | 54069 | 228597_at | 1.0345 | 0.0855 | |
| GSE20347 | MIS18A | 54069 | 219004_s_at | 0.7788 | 0.0000 | |
| GSE23400 | MIS18A | 54069 | 219004_s_at | 0.6071 | 0.0000 | |
| GSE26886 | MIS18A | 54069 | 219004_s_at | -0.6430 | 0.0058 | |
| GSE29001 | MIS18A | 54069 | 219004_s_at | 0.9431 | 0.0226 | |
| GSE38129 | MIS18A | 54069 | 219004_s_at | 0.9715 | 0.0000 | |
| GSE45670 | MIS18A | 54069 | 228597_at | 0.6639 | 0.0000 | |
| GSE53622 | MIS18A | 54069 | 9733 | 0.7023 | 0.0000 | |
| GSE53624 | MIS18A | 54069 | 9733 | 0.9728 | 0.0000 | |
| GSE63941 | MIS18A | 54069 | 228597_at | 1.2591 | 0.0118 | |
| GSE77861 | MIS18A | 54069 | 228597_at | 0.2513 | 0.5808 | |
| GSE97050 | MIS18A | 54069 | A_23_P252335 | 0.3753 | 0.2289 | |
| SRP007169 | MIS18A | 54069 | RNAseq | 0.2800 | 0.5364 | |
| SRP008496 | MIS18A | 54069 | RNAseq | 0.4826 | 0.1591 | |
| SRP064894 | MIS18A | 54069 | RNAseq | 0.8780 | 0.0004 | |
| SRP133303 | MIS18A | 54069 | RNAseq | 0.5563 | 0.0031 | |
| SRP159526 | MIS18A | 54069 | RNAseq | 0.8829 | 0.0016 | |
| SRP193095 | MIS18A | 54069 | RNAseq | 0.2726 | 0.0245 | |
| SRP219564 | MIS18A | 54069 | RNAseq | 0.3521 | 0.3828 |
Upregulated datasets: 1; Downregulated datasets: 0.
Survival by MIS18A expression:
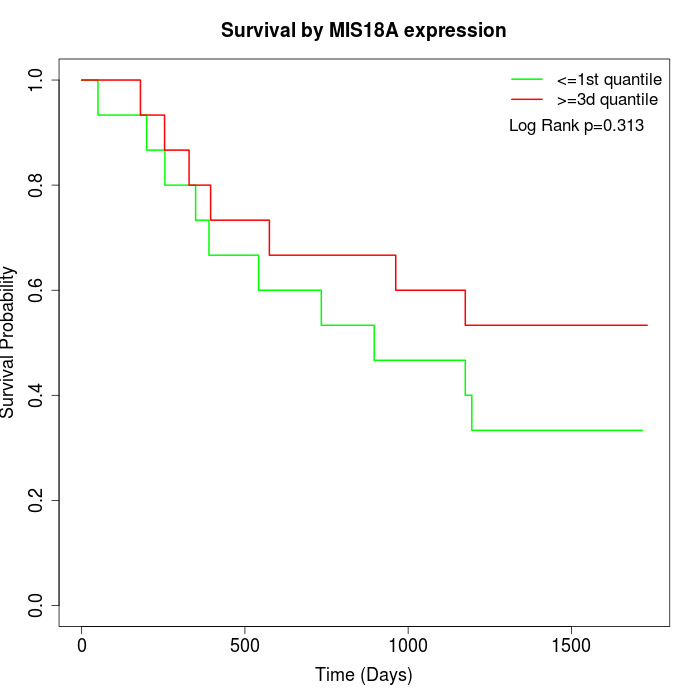 | 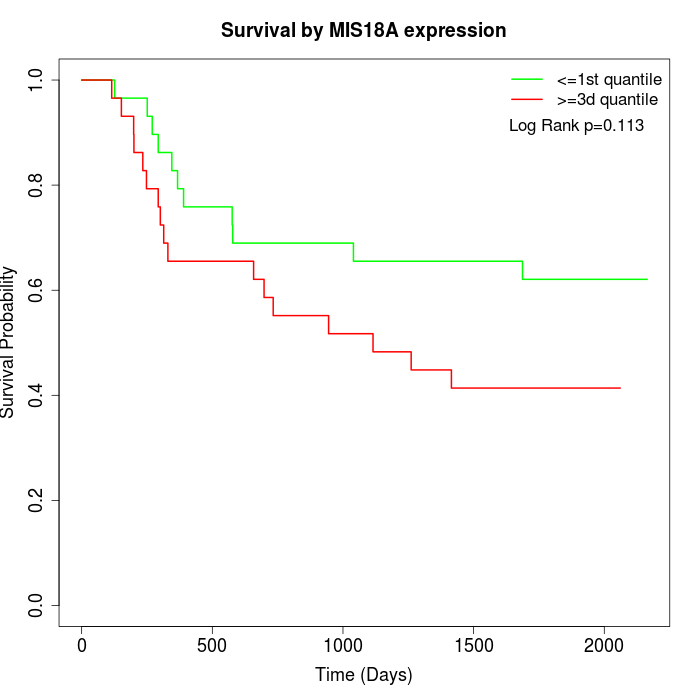 |
| GSE53622 | GSE53624 |
Note: Click image to view full size file.
Copy number change of MIS18A:
| Dataset | Gene | EntrezID | Gain | Loss | Normal | Detail |
|---|---|---|---|---|---|---|
| GSE15526 | MIS18A | 54069 | 2 | 10 | 18 | |
| GSE20123 | MIS18A | 54069 | 2 | 10 | 18 | |
| GSE43470 | MIS18A | 54069 | 2 | 7 | 34 | |
| GSE46452 | MIS18A | 54069 | 1 | 21 | 37 | |
| GSE47630 | MIS18A | 54069 | 6 | 17 | 17 | |
| GSE54993 | MIS18A | 54069 | 9 | 1 | 60 | |
| GSE54994 | MIS18A | 54069 | 1 | 8 | 44 | |
| GSE60625 | MIS18A | 54069 | 0 | 0 | 11 | |
| GSE74703 | MIS18A | 54069 | 2 | 5 | 29 | |
| GSE74704 | MIS18A | 54069 | 1 | 6 | 13 | |
| TCGA | MIS18A | 54069 | 9 | 36 | 51 |
Total number of gains: 35; Total number of losses: 121; Total Number of normals: 332.
Somatic mutations of MIS18A:
Generating mutation plots.
Highly correlated genes for MIS18A:
Showing top 20/1301 corelated genes with mean PCC>0.5.
| Gene1 | Gene2 | Mean PCC | Num. Datasets | Num. PCC<0 | Num. PCC>0.5 |
|---|---|---|---|---|---|
| MIS18A | LRRC58 | 0.826824 | 3 | 0 | 3 |
| MIS18A | MAD2L1 | 0.792699 | 8 | 0 | 8 |
| MIS18A | ANAPC1 | 0.78658 | 3 | 0 | 3 |
| MIS18A | INTS10 | 0.782407 | 3 | 0 | 3 |
| MIS18A | TMEM41B | 0.773118 | 3 | 0 | 3 |
| MIS18A | MRPL39 | 0.767393 | 3 | 0 | 3 |
| MIS18A | HPS3 | 0.763253 | 3 | 0 | 3 |
| MIS18A | PRKDC | 0.763083 | 8 | 0 | 8 |
| MIS18A | NUF2 | 0.762576 | 7 | 0 | 6 |
| MIS18A | MIF | 0.760166 | 3 | 0 | 3 |
| MIS18A | NFXL1 | 0.758892 | 3 | 0 | 3 |
| MIS18A | IFT80 | 0.757189 | 3 | 0 | 3 |
| MIS18A | BUB1 | 0.756921 | 9 | 0 | 8 |
| MIS18A | MCM2 | 0.754552 | 9 | 0 | 9 |
| MIS18A | TPX2 | 0.752707 | 11 | 0 | 11 |
| MIS18A | UBE2C | 0.751632 | 11 | 0 | 10 |
| MIS18A | RPN1 | 0.750825 | 9 | 0 | 9 |
| MIS18A | E2F7 | 0.750306 | 5 | 0 | 5 |
| MIS18A | SCNM1 | 0.748737 | 3 | 0 | 3 |
| MIS18A | DEPDC1B | 0.746846 | 6 | 0 | 6 |
For details and further investigation, click here