| Full name: inositol 1,4,5-trisphosphate receptor type 2 | Alias Symbol: IP3R2|CFAP48 | ||
| Type: protein-coding gene | Cytoband: 12p11.23 | ||
| Entrez ID: 3709 | HGNC ID: HGNC:6181 | Ensembl Gene: ENSG00000123104 | OMIM ID: 600144 |
| Related drugs: ADENOPHOSTIN A, CHEMBL420806, INS(1,4,5)P3, SODIUM ORTHOVANAD, cA2... [more] | |||
ITPR2 involved pathways:
Expression of ITPR2:
| Dataset | Gene | EntrezID | Probe | Log2FC | Adj.pValue | Expression |
|---|---|---|---|---|---|---|
| GSE17351 | ITPR2 | 3709 | 202660_at | -1.2045 | 0.1281 | |
| GSE20347 | ITPR2 | 3709 | 202660_at | -2.4051 | 0.0000 | |
| GSE23400 | ITPR2 | 3709 | 211360_s_at | -0.1235 | 0.0002 | |
| GSE26886 | ITPR2 | 3709 | 202660_at | -1.0802 | 0.0003 | |
| GSE29001 | ITPR2 | 3709 | 202660_at | -1.3481 | 0.0333 | |
| GSE38129 | ITPR2 | 3709 | 202660_at | -1.7885 | 0.0000 | |
| GSE45670 | ITPR2 | 3709 | 202660_at | -1.2980 | 0.0005 | |
| GSE53622 | ITPR2 | 3709 | 2415 | -1.2504 | 0.0000 | |
| GSE53624 | ITPR2 | 3709 | 2415 | -1.6237 | 0.0000 | |
| GSE63941 | ITPR2 | 3709 | 202660_at | -0.6383 | 0.4931 | |
| GSE77861 | ITPR2 | 3709 | 211360_s_at | -0.1833 | 0.2704 | |
| GSE97050 | ITPR2 | 3709 | A_33_P3232294 | -0.0039 | 0.9964 | |
| SRP007169 | ITPR2 | 3709 | RNAseq | -1.5810 | 0.0000 | |
| SRP008496 | ITPR2 | 3709 | RNAseq | -1.0531 | 0.0000 | |
| SRP064894 | ITPR2 | 3709 | RNAseq | -1.3499 | 0.0000 | |
| SRP133303 | ITPR2 | 3709 | RNAseq | -1.4004 | 0.0000 | |
| SRP159526 | ITPR2 | 3709 | RNAseq | -1.2838 | 0.0120 | |
| SRP193095 | ITPR2 | 3709 | RNAseq | -1.4157 | 0.0000 | |
| SRP219564 | ITPR2 | 3709 | RNAseq | -0.9775 | 0.0718 | |
| TCGA | ITPR2 | 3709 | RNAseq | -0.2399 | 0.0123 |
Upregulated datasets: 0; Downregulated datasets: 13.
Survival by ITPR2 expression:
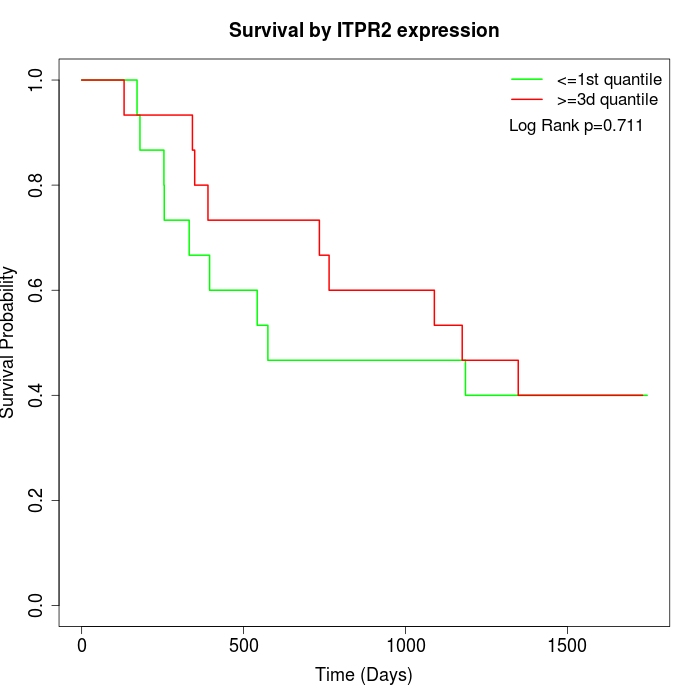 | 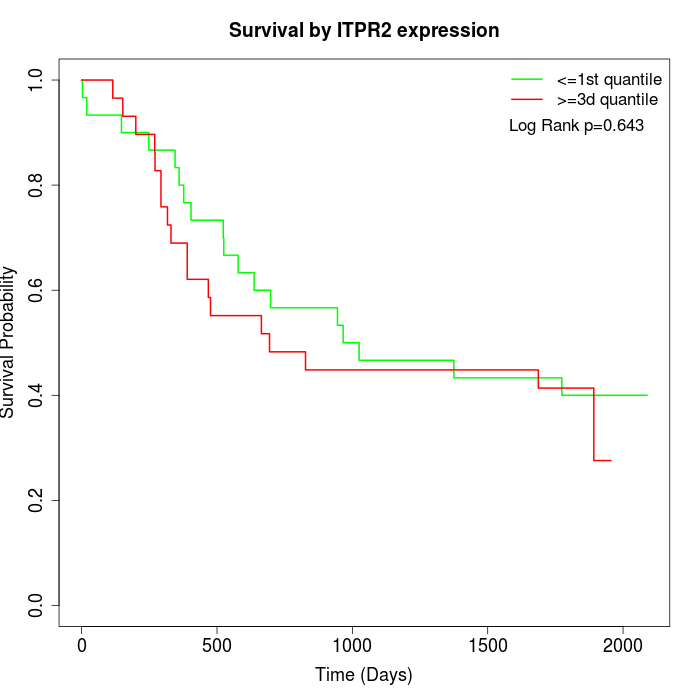 | 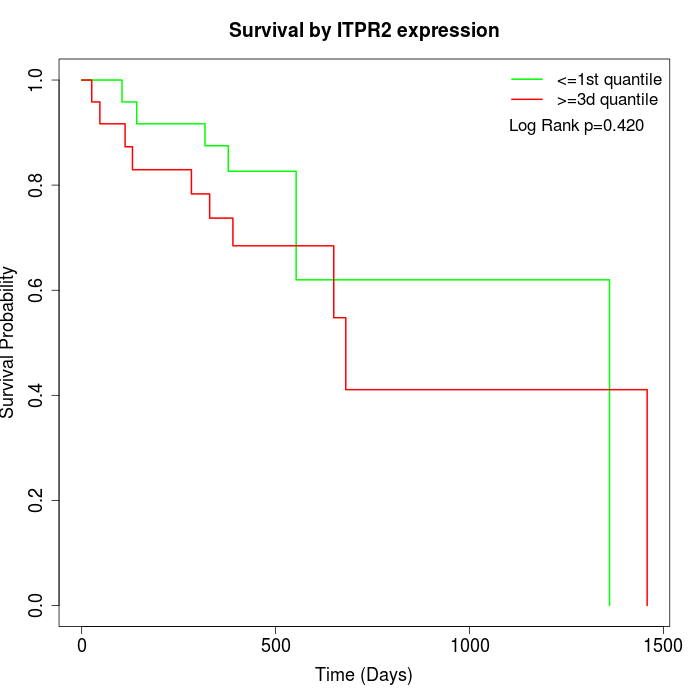 |
| GSE53622 | GSE53624 | TCGA |
Note: Click image to view full size file.
Copy number change of ITPR2:
| Dataset | Gene | EntrezID | Gain | Loss | Normal | Detail |
|---|---|---|---|---|---|---|
| GSE15526 | ITPR2 | 3709 | 10 | 1 | 19 | |
| GSE20123 | ITPR2 | 3709 | 10 | 1 | 19 | |
| GSE43470 | ITPR2 | 3709 | 9 | 4 | 30 | |
| GSE46452 | ITPR2 | 3709 | 10 | 1 | 48 | |
| GSE47630 | ITPR2 | 3709 | 14 | 0 | 26 | |
| GSE54993 | ITPR2 | 3709 | 0 | 9 | 61 | |
| GSE54994 | ITPR2 | 3709 | 11 | 2 | 40 | |
| GSE60625 | ITPR2 | 3709 | 0 | 1 | 10 | |
| GSE74703 | ITPR2 | 3709 | 9 | 3 | 24 | |
| GSE74704 | ITPR2 | 3709 | 6 | 1 | 13 | |
| TCGA | ITPR2 | 3709 | 44 | 6 | 46 |
Total number of gains: 123; Total number of losses: 29; Total Number of normals: 336.
Somatic mutations of ITPR2:
Generating mutation plots.
Highly correlated genes for ITPR2:
Showing top 20/1527 corelated genes with mean PCC>0.5.
| Gene1 | Gene2 | Mean PCC | Num. Datasets | Num. PCC<0 | Num. PCC>0.5 |
|---|---|---|---|---|---|
| ITPR2 | BLNK | 0.786251 | 9 | 0 | 9 |
| ITPR2 | CA13 | 0.785789 | 3 | 0 | 3 |
| ITPR2 | FCHO2 | 0.777143 | 6 | 0 | 6 |
| ITPR2 | A2ML1 | 0.771883 | 5 | 0 | 5 |
| ITPR2 | SPINK7 | 0.761379 | 5 | 0 | 5 |
| ITPR2 | TMPRSS11B | 0.757083 | 5 | 0 | 5 |
| ITPR2 | MLKL | 0.746558 | 3 | 0 | 3 |
| ITPR2 | RASSF5 | 0.745297 | 6 | 0 | 6 |
| ITPR2 | GTF3C6 | 0.745293 | 3 | 0 | 3 |
| ITPR2 | TCP11L2 | 0.745057 | 4 | 0 | 4 |
| ITPR2 | PDLIM5 | 0.735148 | 9 | 0 | 9 |
| ITPR2 | ITSN2 | 0.733423 | 9 | 0 | 9 |
| ITPR2 | DMXL1 | 0.732562 | 9 | 0 | 8 |
| ITPR2 | GRPEL2 | 0.731947 | 6 | 0 | 6 |
| ITPR2 | SLC44A3 | 0.729709 | 6 | 0 | 6 |
| ITPR2 | TAB3 | 0.729609 | 6 | 0 | 6 |
| ITPR2 | ZNF503-AS1 | 0.72353 | 5 | 0 | 5 |
| ITPR2 | CAPNS2 | 0.722912 | 4 | 0 | 4 |
| ITPR2 | RAB10 | 0.719458 | 5 | 0 | 4 |
| ITPR2 | CCNYL1 | 0.718578 | 5 | 0 | 4 |
For details and further investigation, click here