| Full name: potassium voltage-gated channel interacting protein 1 | Alias Symbol: KCHIP1 | ||
| Type: protein-coding gene | Cytoband: 5q35.1 | ||
| Entrez ID: 30820 | HGNC ID: HGNC:15521 | Ensembl Gene: ENSG00000182132 | OMIM ID: 604660 |
Expression of KCNIP1:
| Dataset | Gene | EntrezID | Probe | Log2FC | Adj.pValue | Expression |
|---|---|---|---|---|---|---|
| GSE17351 | KCNIP1 | 30820 | 221307_at | -0.1078 | 0.6507 | |
| GSE20347 | KCNIP1 | 30820 | 221307_at | -0.0086 | 0.9359 | |
| GSE23400 | KCNIP1 | 30820 | 221307_at | -0.1744 | 0.0000 | |
| GSE26886 | KCNIP1 | 30820 | 221307_at | -0.0893 | 0.5397 | |
| GSE29001 | KCNIP1 | 30820 | 221307_at | -0.0581 | 0.6324 | |
| GSE38129 | KCNIP1 | 30820 | 221307_at | -0.1253 | 0.0954 | |
| GSE45670 | KCNIP1 | 30820 | 221307_at | 0.0658 | 0.4190 | |
| GSE53622 | KCNIP1 | 30820 | 12642 | -0.8386 | 0.0000 | |
| GSE53624 | KCNIP1 | 30820 | 12642 | -0.7970 | 0.0000 | |
| GSE63941 | KCNIP1 | 30820 | 221307_at | 0.1776 | 0.2780 | |
| GSE77861 | KCNIP1 | 30820 | 221307_at | -0.0894 | 0.3470 | |
| TCGA | KCNIP1 | 30820 | RNAseq | -1.2777 | 0.0450 |
Upregulated datasets: 0; Downregulated datasets: 1.
Survival by KCNIP1 expression:
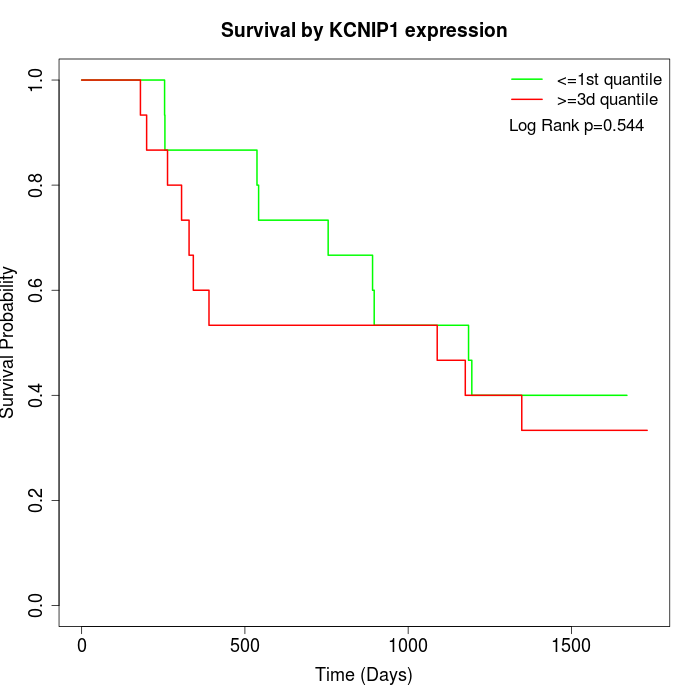 | 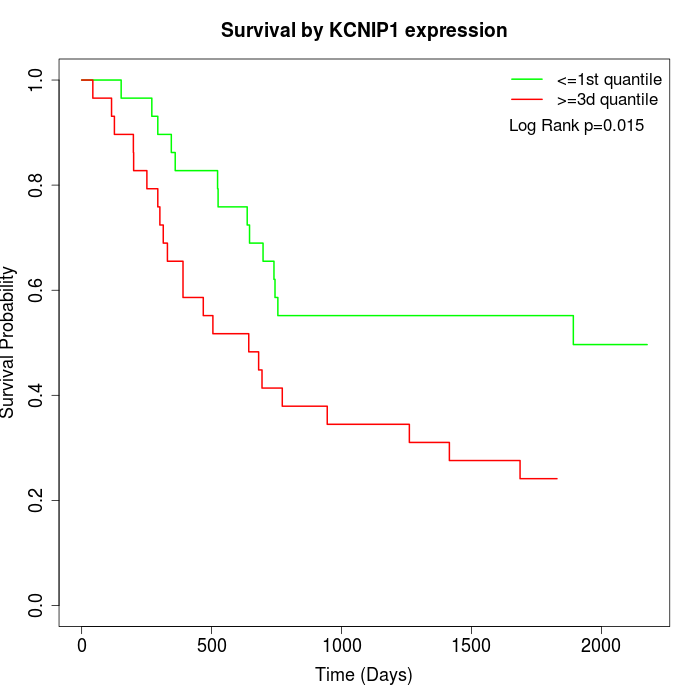 | 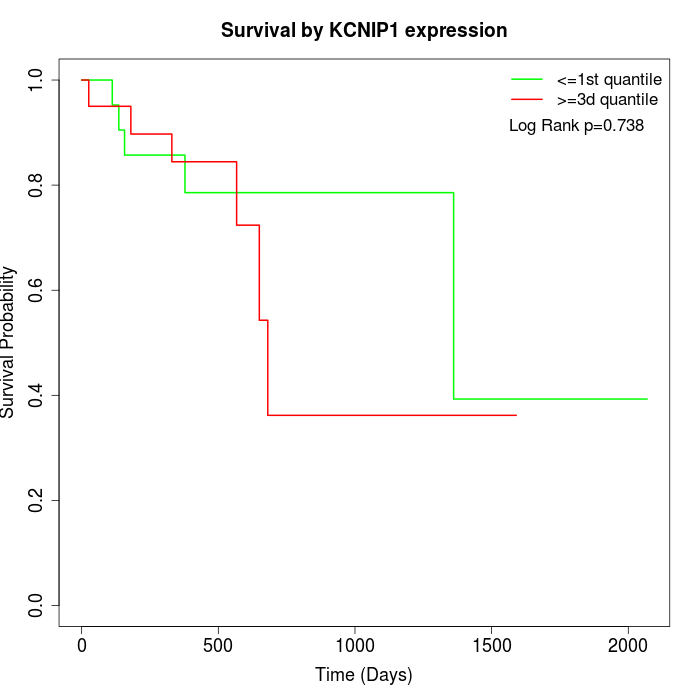 |
| GSE53622 | GSE53624 | TCGA |
Note: Click image to view full size file.
Copy number change of KCNIP1:
| Dataset | Gene | EntrezID | Gain | Loss | Normal | Detail |
|---|---|---|---|---|---|---|
| GSE15526 | KCNIP1 | 30820 | 1 | 13 | 16 | |
| GSE20123 | KCNIP1 | 30820 | 1 | 13 | 16 | |
| GSE43470 | KCNIP1 | 30820 | 1 | 10 | 32 | |
| GSE46452 | KCNIP1 | 30820 | 0 | 27 | 32 | |
| GSE47630 | KCNIP1 | 30820 | 0 | 20 | 20 | |
| GSE54993 | KCNIP1 | 30820 | 9 | 2 | 59 | |
| GSE54994 | KCNIP1 | 30820 | 2 | 15 | 36 | |
| GSE60625 | KCNIP1 | 30820 | 1 | 0 | 10 | |
| GSE74703 | KCNIP1 | 30820 | 1 | 7 | 28 | |
| GSE74704 | KCNIP1 | 30820 | 0 | 6 | 14 | |
| TCGA | KCNIP1 | 30820 | 7 | 36 | 53 |
Total number of gains: 23; Total number of losses: 149; Total Number of normals: 316.
Somatic mutations of KCNIP1:
Generating mutation plots.
Highly correlated genes for KCNIP1:
Showing top 20/731 corelated genes with mean PCC>0.5.
| Gene1 | Gene2 | Mean PCC | Num. Datasets | Num. PCC<0 | Num. PCC>0.5 |
|---|---|---|---|---|---|
| KCNIP1 | MTAP | 0.656525 | 4 | 0 | 4 |
| KCNIP1 | TCTN2 | 0.654122 | 4 | 0 | 4 |
| KCNIP1 | CYP4A11 | 0.652071 | 6 | 0 | 5 |
| KCNIP1 | CACNA1F | 0.648393 | 7 | 0 | 6 |
| KCNIP1 | SCNN1G | 0.646521 | 5 | 0 | 5 |
| KCNIP1 | LINC01013 | 0.645166 | 3 | 0 | 3 |
| KCNIP1 | ASPG | 0.644154 | 3 | 0 | 3 |
| KCNIP1 | ENPP6 | 0.637612 | 3 | 0 | 3 |
| KCNIP1 | LINC00689 | 0.637441 | 3 | 0 | 3 |
| KCNIP1 | HAL | 0.634697 | 5 | 0 | 5 |
| KCNIP1 | PDE6G | 0.634675 | 8 | 0 | 8 |
| KCNIP1 | ZMAT4 | 0.633681 | 4 | 0 | 4 |
| KCNIP1 | RABEP2 | 0.632992 | 4 | 0 | 4 |
| KCNIP1 | KRTAP5-8 | 0.632353 | 7 | 0 | 6 |
| KCNIP1 | CBL | 0.632139 | 4 | 0 | 4 |
| KCNIP1 | TPSG1 | 0.631206 | 8 | 0 | 7 |
| KCNIP1 | KLF15 | 0.630823 | 7 | 0 | 6 |
| KCNIP1 | NPTXR | 0.630598 | 6 | 0 | 6 |
| KCNIP1 | KIR2DS4 | 0.629732 | 5 | 0 | 4 |
| KCNIP1 | OR10H3 | 0.629411 | 6 | 0 | 5 |
For details and further investigation, click here