| Full name: peptidase inhibitor 3 | Alias Symbol: ESI|SKALP|ELAFIN|WAP3|WFDC14|cementoin | ||
| Type: protein-coding gene | Cytoband: 20q13.12 | ||
| Entrez ID: 5266 | HGNC ID: HGNC:8947 | Ensembl Gene: ENSG00000124102 | OMIM ID: 182257 |
| Related drugs: PROGESTERONE... [more] | |||
Expression of PI3:
| Dataset | Gene | EntrezID | Probe | Log2FC | Adj.pValue | Expression |
|---|---|---|---|---|---|---|
| GSE17351 | PI3 | 5266 | 41469_at | -1.4528 | 0.6999 | |
| GSE20347 | PI3 | 5266 | 41469_at | -1.7231 | 0.0272 | |
| GSE23400 | PI3 | 5266 | 203691_at | -1.1814 | 0.0003 | |
| GSE26886 | PI3 | 5266 | 203691_at | -4.4722 | 0.0000 | |
| GSE29001 | PI3 | 5266 | 203691_at | -1.2960 | 0.2722 | |
| GSE38129 | PI3 | 5266 | 41469_at | -0.4663 | 0.5910 | |
| GSE45670 | PI3 | 5266 | 203691_at | 1.8809 | 0.0002 | |
| GSE53622 | PI3 | 5266 | 6373 | -0.1412 | 0.7680 | |
| GSE53624 | PI3 | 5266 | 6373 | -0.8457 | 0.0001 | |
| GSE63941 | PI3 | 5266 | 203691_at | 2.1497 | 0.0883 | |
| GSE77861 | PI3 | 5266 | 41469_at | -0.3322 | 0.6707 | |
| GSE97050 | PI3 | 5266 | A_23_P210465 | 2.2866 | 0.1350 | |
| SRP007169 | PI3 | 5266 | RNAseq | -3.0839 | 0.0000 | |
| SRP008496 | PI3 | 5266 | RNAseq | -2.4116 | 0.0004 | |
| SRP064894 | PI3 | 5266 | RNAseq | -1.1213 | 0.1323 | |
| SRP133303 | PI3 | 5266 | RNAseq | -0.5286 | 0.3611 | |
| SRP193095 | PI3 | 5266 | RNAseq | -0.7627 | 0.1363 | |
| SRP219564 | PI3 | 5266 | RNAseq | -1.7645 | 0.1517 | |
| TCGA | PI3 | 5266 | RNAseq | 1.0231 | 0.0022 |
Upregulated datasets: 2; Downregulated datasets: 5.
Survival by PI3 expression:
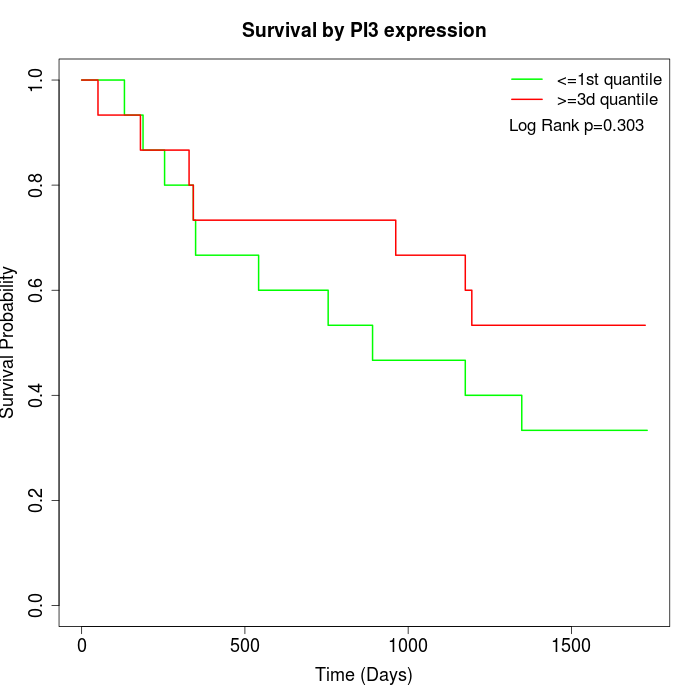 |  |  |
| GSE53622 | GSE53624 | TCGA |
Note: Click image to view full size file.
Copy number change of PI3:
| Dataset | Gene | EntrezID | Gain | Loss | Normal | Detail |
|---|---|---|---|---|---|---|
| GSE15526 | PI3 | 5266 | 13 | 1 | 16 | |
| GSE20123 | PI3 | 5266 | 13 | 1 | 16 | |
| GSE43470 | PI3 | 5266 | 12 | 1 | 30 | |
| GSE46452 | PI3 | 5266 | 29 | 0 | 30 | |
| GSE47630 | PI3 | 5266 | 24 | 1 | 15 | |
| GSE54993 | PI3 | 5266 | 0 | 17 | 53 | |
| GSE54994 | PI3 | 5266 | 25 | 0 | 28 | |
| GSE60625 | PI3 | 5266 | 0 | 0 | 11 | |
| GSE74703 | PI3 | 5266 | 10 | 1 | 25 | |
| GSE74704 | PI3 | 5266 | 9 | 0 | 11 | |
| TCGA | PI3 | 5266 | 45 | 3 | 48 |
Total number of gains: 180; Total number of losses: 25; Total Number of normals: 283.
Somatic mutations of PI3:
Generating mutation plots.
Highly correlated genes for PI3:
Showing top 20/458 corelated genes with mean PCC>0.5.
| Gene1 | Gene2 | Mean PCC | Num. Datasets | Num. PCC<0 | Num. PCC>0.5 |
|---|---|---|---|---|---|
| PI3 | MTA3 | 0.727422 | 3 | 0 | 3 |
| PI3 | IL36RN | 0.726365 | 10 | 0 | 10 |
| PI3 | ITGAD | 0.722674 | 3 | 0 | 3 |
| PI3 | SLPI | 0.72181 | 13 | 0 | 11 |
| PI3 | SPRR2D | 0.707873 | 4 | 0 | 4 |
| PI3 | SPRR1B | 0.705027 | 13 | 0 | 12 |
| PI3 | KLK10 | 0.700029 | 10 | 0 | 8 |
| PI3 | SPRR2E | 0.696215 | 4 | 0 | 4 |
| PI3 | B4GALNT3 | 0.694906 | 4 | 0 | 4 |
| PI3 | PGLYRP3 | 0.690331 | 4 | 0 | 4 |
| PI3 | IL20RB | 0.688455 | 7 | 0 | 6 |
| PI3 | KLK7 | 0.68314 | 12 | 0 | 11 |
| PI3 | KRT6C | 0.680622 | 4 | 0 | 3 |
| PI3 | GJB2 | 0.679358 | 5 | 0 | 4 |
| PI3 | SERPINB3 | 0.674234 | 10 | 0 | 8 |
| PI3 | DMKN | 0.673489 | 9 | 0 | 7 |
| PI3 | CERS3 | 0.673007 | 6 | 0 | 5 |
| PI3 | SDR16C5 | 0.670372 | 4 | 0 | 3 |
| PI3 | TMPRSS11D | 0.669437 | 11 | 0 | 10 |
| PI3 | LYPD3 | 0.667385 | 11 | 0 | 10 |
For details and further investigation, click here