| Full name: LIM domain and actin binding 1 | Alias Symbol: EPLIN | ||
| Type: protein-coding gene | Cytoband: 12q13.12 | ||
| Entrez ID: 51474 | HGNC ID: HGNC:24636 | Ensembl Gene: ENSG00000050405 | OMIM ID: 608364 |
Expression of LIMA1:
| Dataset | Gene | EntrezID | Probe | Log2FC | Adj.pValue | Expression |
|---|---|---|---|---|---|---|
| GSE17351 | LIMA1 | 51474 | 217892_s_at | 0.5089 | 0.3549 | |
| GSE20347 | LIMA1 | 51474 | 217892_s_at | 0.5901 | 0.0376 | |
| GSE23400 | LIMA1 | 51474 | 217892_s_at | 0.6596 | 0.0000 | |
| GSE26886 | LIMA1 | 51474 | 217892_s_at | 0.9289 | 0.0024 | |
| GSE29001 | LIMA1 | 51474 | 217892_s_at | 0.9049 | 0.0050 | |
| GSE38129 | LIMA1 | 51474 | 217892_s_at | 0.6731 | 0.0018 | |
| GSE45670 | LIMA1 | 51474 | 217892_s_at | 0.5787 | 0.0348 | |
| GSE53622 | LIMA1 | 51474 | 122438 | 0.9077 | 0.0000 | |
| GSE53624 | LIMA1 | 51474 | 122438 | 0.9270 | 0.0000 | |
| GSE63941 | LIMA1 | 51474 | 217892_s_at | -0.4193 | 0.6141 | |
| GSE77861 | LIMA1 | 51474 | 217892_s_at | 1.1071 | 0.0150 | |
| GSE97050 | LIMA1 | 51474 | A_23_P151267 | 0.3831 | 0.3370 | |
| SRP007169 | LIMA1 | 51474 | RNAseq | 1.6795 | 0.0003 | |
| SRP008496 | LIMA1 | 51474 | RNAseq | 1.7817 | 0.0000 | |
| SRP064894 | LIMA1 | 51474 | RNAseq | 0.8272 | 0.0014 | |
| SRP133303 | LIMA1 | 51474 | RNAseq | 1.2365 | 0.0000 | |
| SRP159526 | LIMA1 | 51474 | RNAseq | 0.3855 | 0.2947 | |
| SRP193095 | LIMA1 | 51474 | RNAseq | 0.5335 | 0.0446 | |
| SRP219564 | LIMA1 | 51474 | RNAseq | 0.5222 | 0.2844 | |
| TCGA | LIMA1 | 51474 | RNAseq | 0.0982 | 0.1557 |
Upregulated datasets: 4; Downregulated datasets: 0.
Survival by LIMA1 expression:
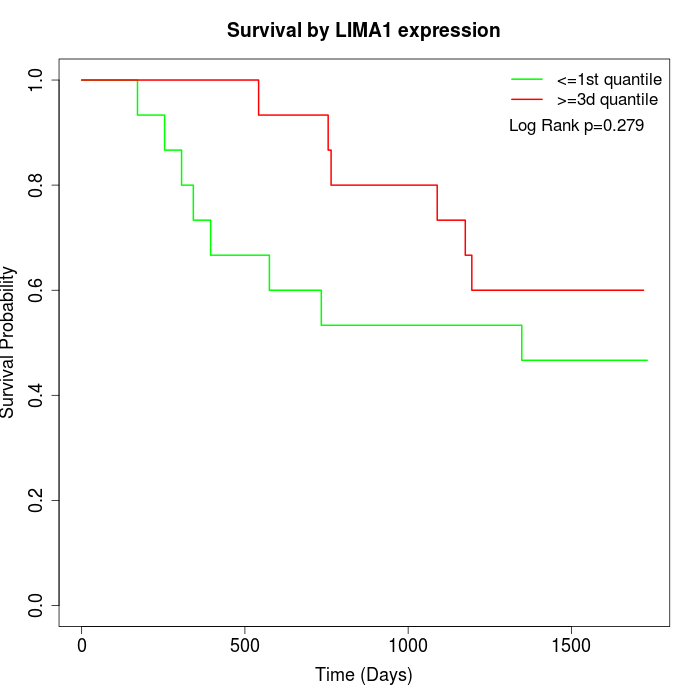 | 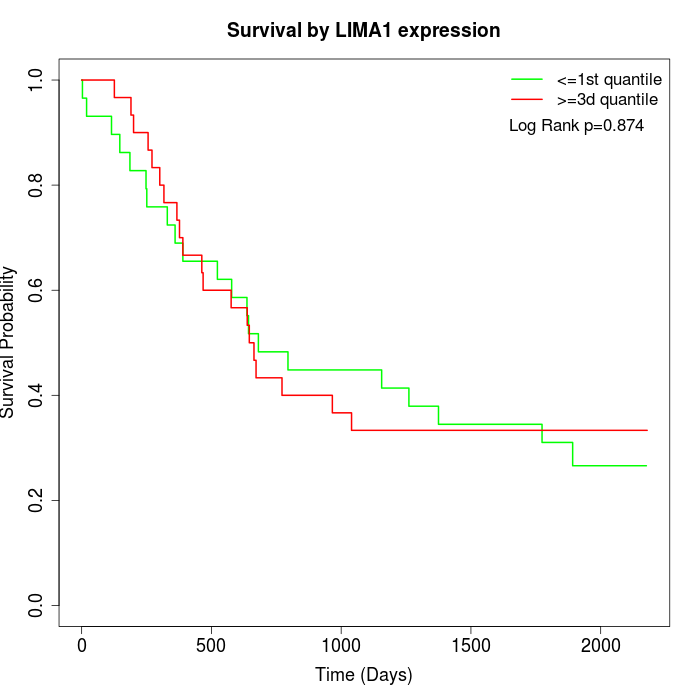 | 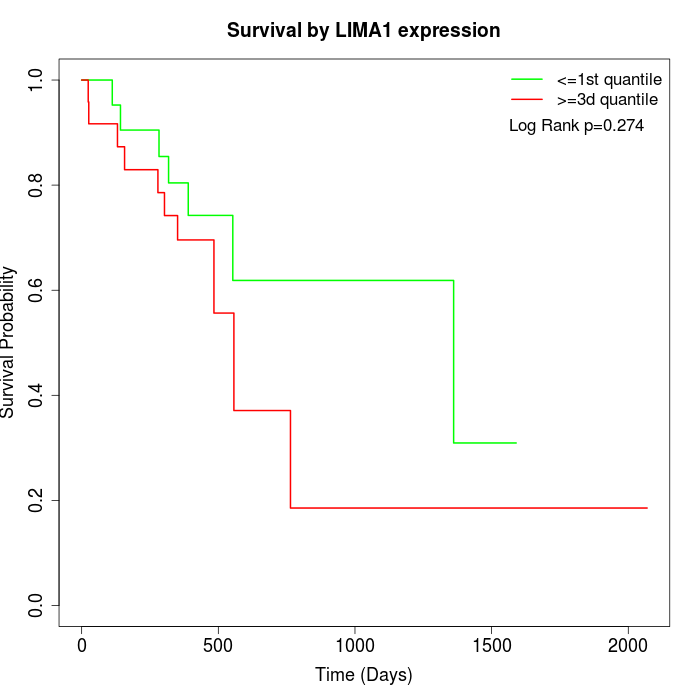 |
| GSE53622 | GSE53624 | TCGA |
Note: Click image to view full size file.
Copy number change of LIMA1:
| Dataset | Gene | EntrezID | Gain | Loss | Normal | Detail |
|---|---|---|---|---|---|---|
| GSE15526 | LIMA1 | 51474 | 8 | 1 | 21 | |
| GSE20123 | LIMA1 | 51474 | 8 | 1 | 21 | |
| GSE43470 | LIMA1 | 51474 | 3 | 0 | 40 | |
| GSE46452 | LIMA1 | 51474 | 8 | 1 | 50 | |
| GSE47630 | LIMA1 | 51474 | 11 | 2 | 27 | |
| GSE54993 | LIMA1 | 51474 | 0 | 5 | 65 | |
| GSE54994 | LIMA1 | 51474 | 3 | 2 | 48 | |
| GSE60625 | LIMA1 | 51474 | 0 | 0 | 11 | |
| GSE74703 | LIMA1 | 51474 | 3 | 0 | 33 | |
| GSE74704 | LIMA1 | 51474 | 5 | 1 | 14 | |
| TCGA | LIMA1 | 51474 | 15 | 11 | 70 |
Total number of gains: 64; Total number of losses: 24; Total Number of normals: 400.
Somatic mutations of LIMA1:
Generating mutation plots.
Highly correlated genes for LIMA1:
Showing top 20/1318 corelated genes with mean PCC>0.5.
| Gene1 | Gene2 | Mean PCC | Num. Datasets | Num. PCC<0 | Num. PCC>0.5 |
|---|---|---|---|---|---|
| LIMA1 | KLHL13 | 0.756901 | 3 | 0 | 3 |
| LIMA1 | XPR1 | 0.756195 | 7 | 0 | 7 |
| LIMA1 | FBLIM1 | 0.729937 | 7 | 0 | 6 |
| LIMA1 | WDR54 | 0.728133 | 7 | 0 | 7 |
| LIMA1 | LAMC2 | 0.713976 | 11 | 0 | 10 |
| LIMA1 | ITGA6 | 0.713737 | 11 | 0 | 11 |
| LIMA1 | TGFBI | 0.712125 | 13 | 0 | 13 |
| LIMA1 | DCBLD1 | 0.711636 | 7 | 0 | 6 |
| LIMA1 | SPECC1 | 0.702829 | 4 | 0 | 4 |
| LIMA1 | SH3RF3 | 0.700974 | 3 | 0 | 3 |
| LIMA1 | NEDD1 | 0.69766 | 6 | 0 | 6 |
| LIMA1 | MYO5A | 0.692644 | 12 | 0 | 11 |
| LIMA1 | CD276 | 0.688257 | 4 | 0 | 4 |
| LIMA1 | ASB7 | 0.688099 | 3 | 0 | 3 |
| LIMA1 | TMTC1 | 0.687824 | 3 | 0 | 3 |
| LIMA1 | LRRC8C | 0.687529 | 4 | 0 | 4 |
| LIMA1 | USP40 | 0.686153 | 3 | 0 | 3 |
| LIMA1 | ITGA3 | 0.685424 | 11 | 0 | 10 |
| LIMA1 | C12orf75 | 0.68432 | 7 | 0 | 7 |
| LIMA1 | TNC | 0.68297 | 12 | 0 | 12 |
For details and further investigation, click here