| Full name: LSM family member 14B | Alias Symbol: FT005|bA11M20.3|FLJ25473|LSM13|RAP55B | ||
| Type: protein-coding gene | Cytoband: 20q13.33 | ||
| Entrez ID: 149986 | HGNC ID: HGNC:15887 | Ensembl Gene: ENSG00000149657 | OMIM ID: |
Expression of LSM14B:
| Dataset | Gene | EntrezID | Probe | Log2FC | Adj.pValue | Expression |
|---|---|---|---|---|---|---|
| GSE17351 | LSM14B | 149986 | 219653_at | 0.6294 | 0.1323 | |
| GSE20347 | LSM14B | 149986 | 219653_at | -0.0040 | 0.9806 | |
| GSE23400 | LSM14B | 149986 | 219653_at | 0.0403 | 0.3327 | |
| GSE26886 | LSM14B | 149986 | 219653_at | -0.2810 | 0.1364 | |
| GSE29001 | LSM14B | 149986 | 219653_at | 0.0202 | 0.9413 | |
| GSE38129 | LSM14B | 149986 | 219653_at | 0.0931 | 0.4389 | |
| GSE45670 | LSM14B | 149986 | 219653_at | -0.1038 | 0.4320 | |
| GSE53622 | LSM14B | 149986 | 49330 | 0.2125 | 0.0039 | |
| GSE53624 | LSM14B | 149986 | 49330 | 0.2597 | 0.0001 | |
| GSE63941 | LSM14B | 149986 | 219653_at | 0.6567 | 0.0735 | |
| GSE77861 | LSM14B | 149986 | 219653_at | 0.1980 | 0.1375 | |
| GSE97050 | LSM14B | 149986 | A_23_P323783 | 0.4570 | 0.3137 | |
| SRP007169 | LSM14B | 149986 | RNAseq | 0.1579 | 0.6676 | |
| SRP008496 | LSM14B | 149986 | RNAseq | 0.1308 | 0.5926 | |
| SRP064894 | LSM14B | 149986 | RNAseq | 0.2289 | 0.2144 | |
| SRP133303 | LSM14B | 149986 | RNAseq | 0.0376 | 0.7449 | |
| SRP159526 | LSM14B | 149986 | RNAseq | 0.4516 | 0.1589 | |
| SRP193095 | LSM14B | 149986 | RNAseq | 0.0299 | 0.7647 | |
| SRP219564 | LSM14B | 149986 | RNAseq | 0.2618 | 0.1942 | |
| TCGA | LSM14B | 149986 | RNAseq | 0.1674 | 0.0020 |
Upregulated datasets: 0; Downregulated datasets: 0.
Survival by LSM14B expression:
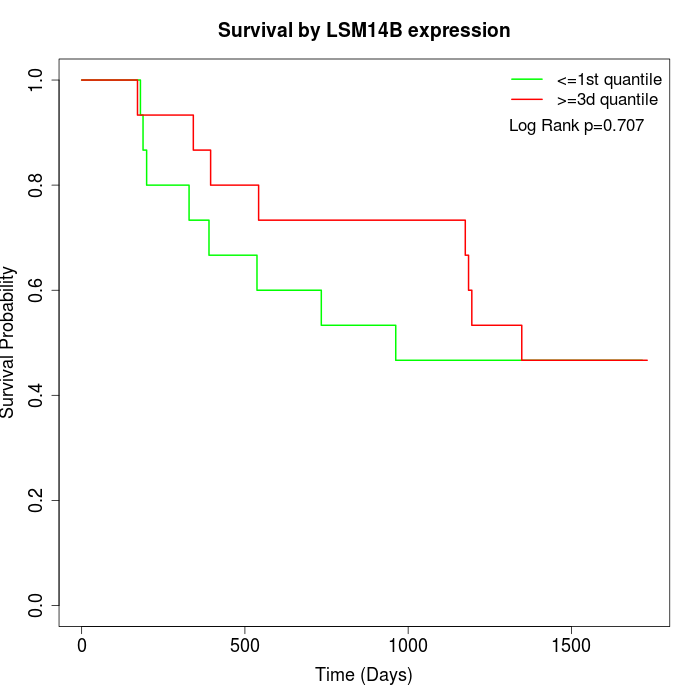 | 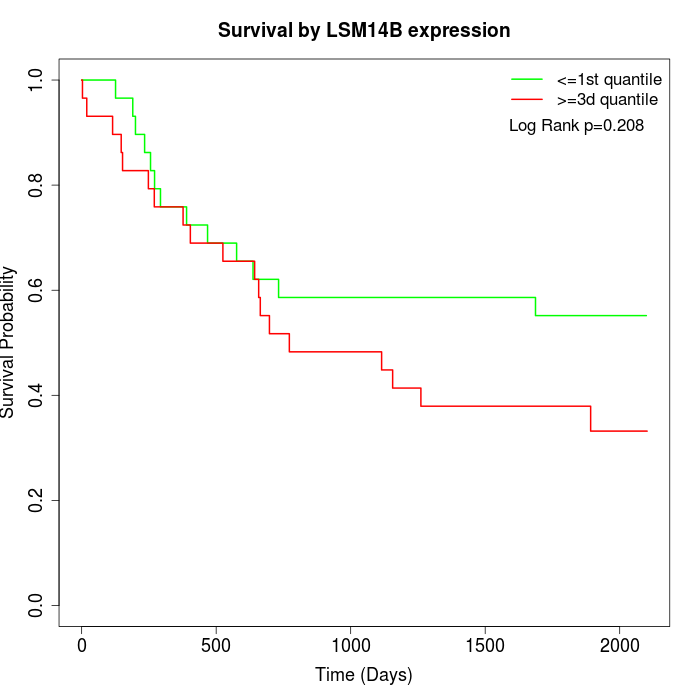 | 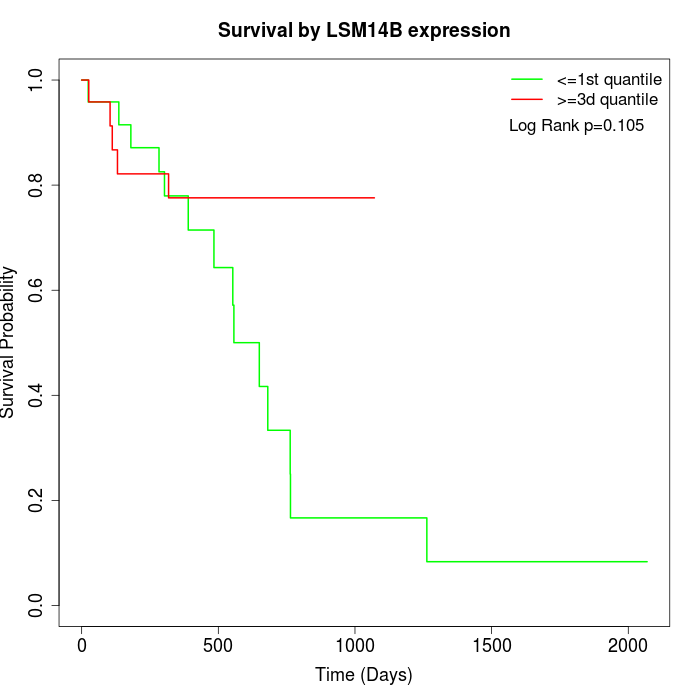 |
| GSE53622 | GSE53624 | TCGA |
Note: Click image to view full size file.
Copy number change of LSM14B:
| Dataset | Gene | EntrezID | Gain | Loss | Normal | Detail |
|---|---|---|---|---|---|---|
| GSE15526 | LSM14B | 149986 | 13 | 2 | 15 | |
| GSE20123 | LSM14B | 149986 | 14 | 2 | 14 | |
| GSE43470 | LSM14B | 149986 | 11 | 1 | 31 | |
| GSE46452 | LSM14B | 149986 | 35 | 0 | 24 | |
| GSE47630 | LSM14B | 149986 | 25 | 1 | 14 | |
| GSE54993 | LSM14B | 149986 | 0 | 17 | 53 | |
| GSE54994 | LSM14B | 149986 | 29 | 0 | 24 | |
| GSE60625 | LSM14B | 149986 | 0 | 0 | 11 | |
| GSE74703 | LSM14B | 149986 | 10 | 0 | 26 | |
| GSE74704 | LSM14B | 149986 | 11 | 0 | 9 | |
| TCGA | LSM14B | 149986 | 43 | 4 | 49 |
Total number of gains: 191; Total number of losses: 27; Total Number of normals: 270.
Somatic mutations of LSM14B:
Generating mutation plots.
Highly correlated genes for LSM14B:
Showing top 20/336 corelated genes with mean PCC>0.5.
| Gene1 | Gene2 | Mean PCC | Num. Datasets | Num. PCC<0 | Num. PCC>0.5 |
|---|---|---|---|---|---|
| LSM14B | SF3B2 | 0.792132 | 3 | 0 | 3 |
| LSM14B | XAB2 | 0.776193 | 3 | 0 | 3 |
| LSM14B | RFX1 | 0.757661 | 3 | 0 | 3 |
| LSM14B | ERH | 0.748713 | 3 | 0 | 3 |
| LSM14B | HOXD8 | 0.747021 | 3 | 0 | 3 |
| LSM14B | PEX13 | 0.744731 | 3 | 0 | 3 |
| LSM14B | TBC1D23 | 0.744601 | 3 | 0 | 3 |
| LSM14B | MOB3C | 0.74353 | 3 | 0 | 3 |
| LSM14B | POM121 | 0.741393 | 3 | 0 | 3 |
| LSM14B | PFDN2 | 0.733475 | 3 | 0 | 3 |
| LSM14B | URB2 | 0.733354 | 3 | 0 | 3 |
| LSM14B | SLC38A7 | 0.728653 | 3 | 0 | 3 |
| LSM14B | CPNE8 | 0.724558 | 3 | 0 | 3 |
| LSM14B | RSRC1 | 0.724088 | 3 | 0 | 3 |
| LSM14B | TMEM63B | 0.72376 | 3 | 0 | 3 |
| LSM14B | C18orf54 | 0.722976 | 3 | 0 | 3 |
| LSM14B | HGS | 0.720156 | 3 | 0 | 3 |
| LSM14B | GORAB | 0.719589 | 3 | 0 | 3 |
| LSM14B | IMPDH1 | 0.716494 | 4 | 0 | 3 |
| LSM14B | DENND4B | 0.715766 | 4 | 0 | 4 |
For details and further investigation, click here