| Full name: microtubule associated protein RP/EB family member 3 | Alias Symbol: RP3|EB3 | ||
| Type: protein-coding gene | Cytoband: 2p23.3 | ||
| Entrez ID: 22924 | HGNC ID: HGNC:6892 | Ensembl Gene: ENSG00000084764 | OMIM ID: 605788 |
| Drug and gene relationship at DGIdb | |||
Expression of MAPRE3:
| Dataset | Gene | EntrezID | Probe | Log2FC | Adj.pValue | Expression |
|---|---|---|---|---|---|---|
| GSE17351 | MAPRE3 | 22924 | 203842_s_at | 0.0438 | 0.9107 | |
| GSE20347 | MAPRE3 | 22924 | 203842_s_at | 0.1193 | 0.1464 | |
| GSE23400 | MAPRE3 | 22924 | 203842_s_at | 0.0050 | 0.9399 | |
| GSE26886 | MAPRE3 | 22924 | 203842_s_at | 0.3417 | 0.0359 | |
| GSE29001 | MAPRE3 | 22924 | 203842_s_at | -0.1108 | 0.7296 | |
| GSE38129 | MAPRE3 | 22924 | 203842_s_at | 0.0138 | 0.9017 | |
| GSE45670 | MAPRE3 | 22924 | 203842_s_at | -0.0284 | 0.7836 | |
| GSE53622 | MAPRE3 | 22924 | 9253 | 0.4850 | 0.0008 | |
| GSE53624 | MAPRE3 | 22924 | 9253 | 0.5820 | 0.0000 | |
| GSE63941 | MAPRE3 | 22924 | 203842_s_at | 0.1375 | 0.5401 | |
| GSE77861 | MAPRE3 | 22924 | 203842_s_at | 0.0492 | 0.8597 | |
| GSE97050 | MAPRE3 | 22924 | A_23_P131683 | -0.2044 | 0.6203 | |
| SRP007169 | MAPRE3 | 22924 | RNAseq | 0.8616 | 0.2129 | |
| SRP008496 | MAPRE3 | 22924 | RNAseq | 0.7694 | 0.1295 | |
| SRP064894 | MAPRE3 | 22924 | RNAseq | 0.6420 | 0.0165 | |
| SRP133303 | MAPRE3 | 22924 | RNAseq | 0.6799 | 0.0106 | |
| SRP159526 | MAPRE3 | 22924 | RNAseq | 1.1204 | 0.0023 | |
| SRP193095 | MAPRE3 | 22924 | RNAseq | 1.1429 | 0.0000 | |
| SRP219564 | MAPRE3 | 22924 | RNAseq | -0.0997 | 0.8209 | |
| TCGA | MAPRE3 | 22924 | RNAseq | -0.0638 | 0.5484 |
Upregulated datasets: 2; Downregulated datasets: 0.
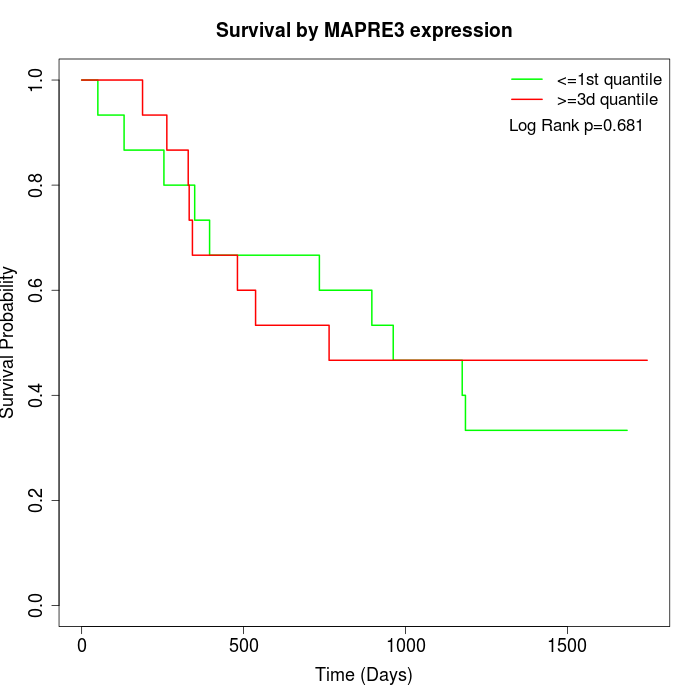
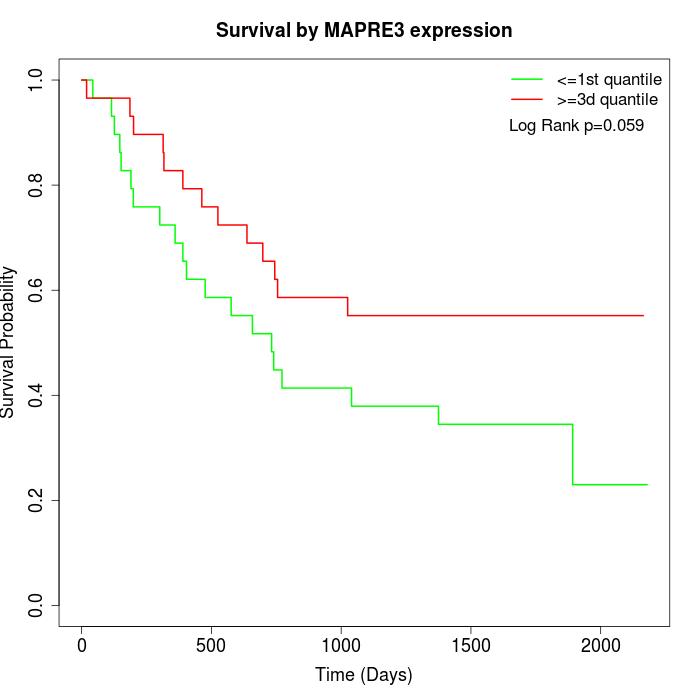
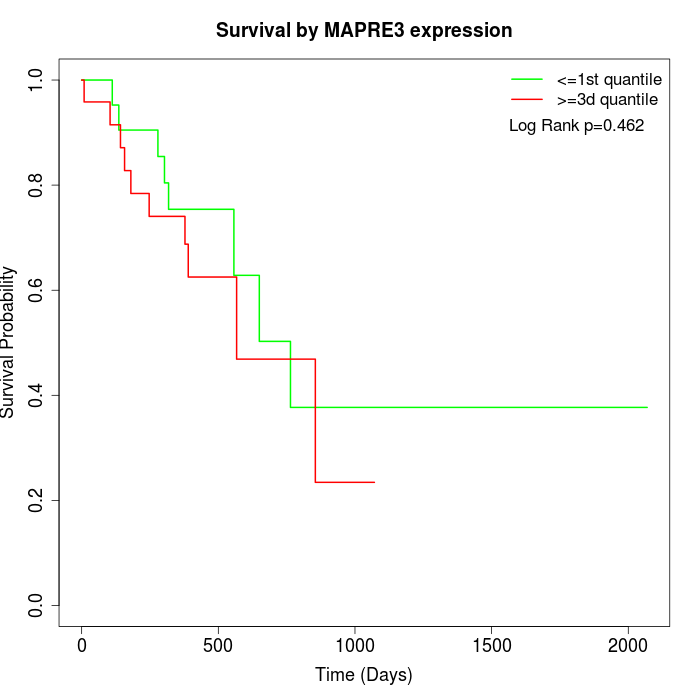
Survival by MAPRE3 expression:
Note: Click image to view full size file.
Copy number change of MAPRE3:
| Dataset | Gene | EntrezID | Gain | Loss | Normal | Detail |
|---|---|---|---|---|---|---|
| GSE15526 | MAPRE3 | 22924 | 11 | 2 | 17 | |
| GSE20123 | MAPRE3 | 22924 | 11 | 2 | 17 | |
| GSE43470 | MAPRE3 | 22924 | 3 | 1 | 39 | |
| GSE46452 | MAPRE3 | 22924 | 3 | 4 | 52 | |
| GSE47630 | MAPRE3 | 22924 | 8 | 0 | 32 | |
| GSE54993 | MAPRE3 | 22924 | 0 | 6 | 64 | |
| GSE54994 | MAPRE3 | 22924 | 10 | 0 | 43 | |
| GSE60625 | MAPRE3 | 22924 | 0 | 3 | 8 | |
| GSE74703 | MAPRE3 | 22924 | 3 | 0 | 33 | |
| GSE74704 | MAPRE3 | 22924 | 9 | 1 | 10 | |
| TCGA | MAPRE3 | 22924 | 37 | 2 | 57 |
Total number of gains: 95; Total number of losses: 21; Total Number of normals: 372.
Somatic mutations of MAPRE3:
Generating mutation plots.
Highly correlated genes for MAPRE3:
Showing top 20/742 corelated genes with mean PCC>0.5.
| Gene1 | Gene2 | Mean PCC | Num. Datasets | Num. PCC<0 | Num. PCC>0.5 |
|---|---|---|---|---|---|
| MAPRE3 | DNAH11 | 0.795177 | 3 | 0 | 3 |
| MAPRE3 | CYP27A1 | 0.79463 | 3 | 0 | 3 |
| MAPRE3 | DERL3 | 0.791162 | 3 | 0 | 3 |
| MAPRE3 | SIK1 | 0.785364 | 5 | 0 | 5 |
| MAPRE3 | LIPF | 0.77729 | 3 | 0 | 3 |
| MAPRE3 | ZMIZ2 | 0.771239 | 3 | 0 | 3 |
| MAPRE3 | TMEM222 | 0.76138 | 3 | 0 | 3 |
| MAPRE3 | WTIP | 0.758335 | 3 | 0 | 3 |
| MAPRE3 | HSPA12A | 0.756779 | 3 | 0 | 3 |
| MAPRE3 | XRRA1 | 0.746035 | 3 | 0 | 3 |
| MAPRE3 | CLDN18 | 0.745851 | 3 | 0 | 3 |
| MAPRE3 | NAALADL1 | 0.745349 | 3 | 0 | 3 |
| MAPRE3 | INTS1 | 0.743917 | 3 | 0 | 3 |
| MAPRE3 | SPSB4 | 0.742197 | 3 | 0 | 3 |
| MAPRE3 | PNCK | 0.738316 | 3 | 0 | 3 |
| MAPRE3 | KLF16 | 0.736753 | 5 | 0 | 5 |
| MAPRE3 | CDK14 | 0.732689 | 3 | 0 | 3 |
| MAPRE3 | NFAM1 | 0.730582 | 4 | 0 | 4 |
| MAPRE3 | DCTN1 | 0.728513 | 4 | 0 | 4 |
| MAPRE3 | PPP1R15A | 0.727041 | 3 | 0 | 3 |
For details and further investigation, click here


