| Full name: MDS1 and EVI1 complex locus | Alias Symbol: MDS1-EVI1|PRDM3|KMT8E | ||
| Type: protein-coding gene | Cytoband: 3q26.2 | ||
| Entrez ID: 2122 | HGNC ID: HGNC:3498 | Ensembl Gene: ENSG00000085276 | OMIM ID: 165215 |
Screen Evidence:
| |||
MECOM involved pathways:
| KEGG pathway | Description | View |
|---|---|---|
| hsa04010 | MAPK signaling pathway | |
| hsa05200 | Pathways in cancer | |
| hsa05220 | Chronic myeloid leukemia |
Expression of MECOM:
| Dataset | Gene | EntrezID | Probe | Log2FC | Adj.pValue | Expression |
|---|---|---|---|---|---|---|
| GSE17351 | MECOM | 2122 | 221884_at | -0.3735 | 0.7487 | |
| GSE20347 | MECOM | 2122 | 221884_at | -1.1970 | 0.0015 | |
| GSE23400 | MECOM | 2122 | 221884_at | -0.9073 | 0.0000 | |
| GSE26886 | MECOM | 2122 | 226420_at | -2.6665 | 0.0001 | |
| GSE29001 | MECOM | 2122 | 221884_at | -2.0249 | 0.0014 | |
| GSE38129 | MECOM | 2122 | 221884_at | -1.2546 | 0.0000 | |
| GSE45670 | MECOM | 2122 | 226420_at | -0.8356 | 0.0446 | |
| GSE53622 | MECOM | 2122 | 105731 | -1.6080 | 0.0000 | |
| GSE53624 | MECOM | 2122 | 105731 | -1.9602 | 0.0000 | |
| GSE63941 | MECOM | 2122 | 221884_at | 1.1812 | 0.4046 | |
| GSE77861 | MECOM | 2122 | 221884_at | -1.3444 | 0.0063 | |
| GSE97050 | MECOM | 2122 | A_23_P317324 | -0.3065 | 0.5572 | |
| SRP007169 | MECOM | 2122 | RNAseq | -1.6517 | 0.0059 | |
| SRP008496 | MECOM | 2122 | RNAseq | -1.7853 | 0.0000 | |
| SRP064894 | MECOM | 2122 | RNAseq | -0.9353 | 0.0005 | |
| SRP133303 | MECOM | 2122 | RNAseq | -0.7818 | 0.0226 | |
| SRP159526 | MECOM | 2122 | RNAseq | -0.7445 | 0.0103 | |
| SRP193095 | MECOM | 2122 | RNAseq | -1.0191 | 0.0014 | |
| SRP219564 | MECOM | 2122 | RNAseq | -0.3297 | 0.6666 | |
| TCGA | MECOM | 2122 | RNAseq | -0.8185 | 0.0000 |
Upregulated datasets: 0; Downregulated datasets: 10.
Survival by MECOM expression:
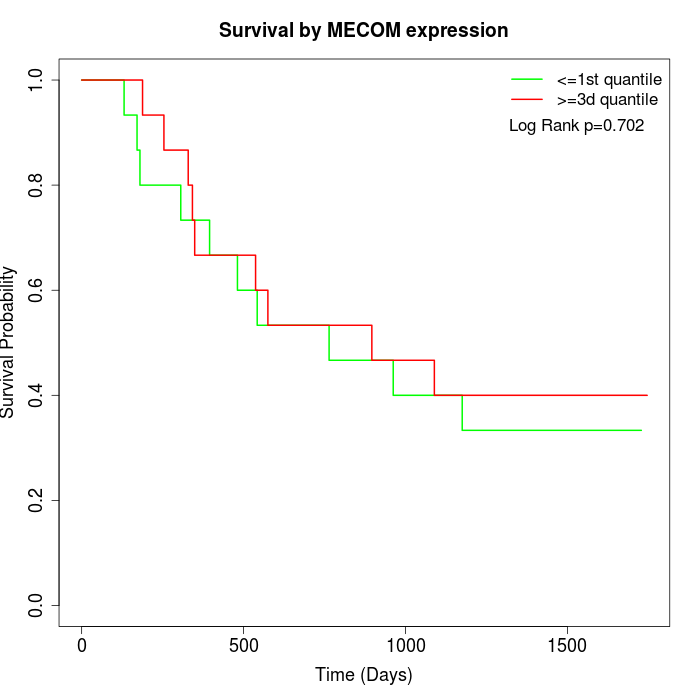 | 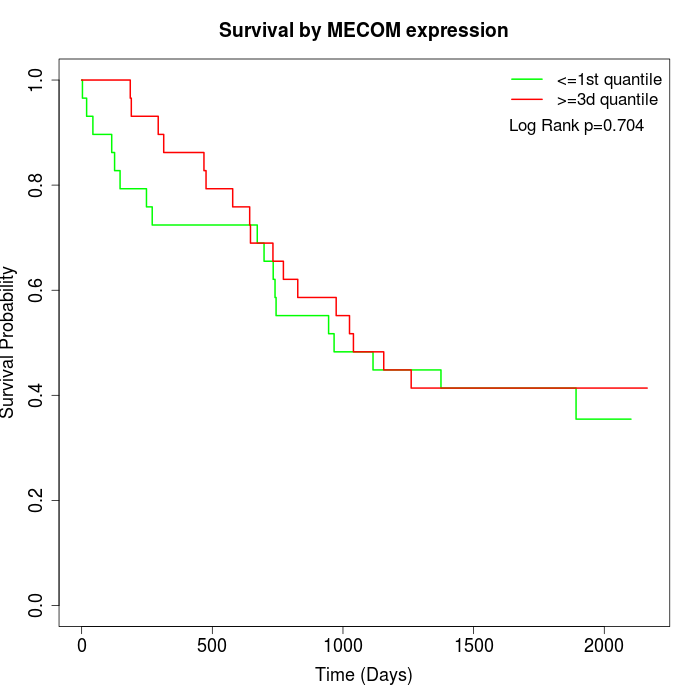 | 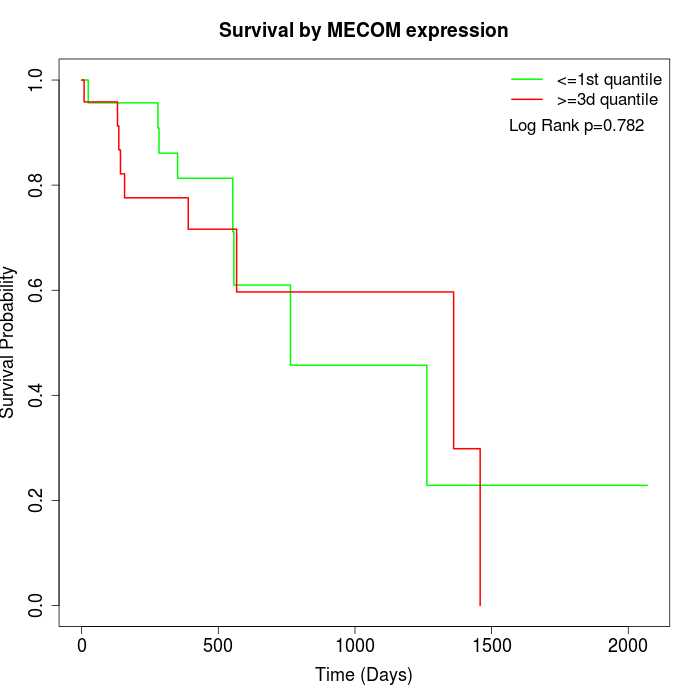 |
| GSE53622 | GSE53624 | TCGA |
Note: Click image to view full size file.
Copy number change of MECOM:
| Dataset | Gene | EntrezID | Gain | Loss | Normal | Detail |
|---|---|---|---|---|---|---|
| GSE15526 | MECOM | 2122 | 23 | 0 | 7 | |
| GSE20123 | MECOM | 2122 | 23 | 0 | 7 | |
| GSE43470 | MECOM | 2122 | 24 | 0 | 19 | |
| GSE46452 | MECOM | 2122 | 19 | 1 | 39 | |
| GSE47630 | MECOM | 2122 | 27 | 2 | 11 | |
| GSE54993 | MECOM | 2122 | 1 | 14 | 55 | |
| GSE54994 | MECOM | 2122 | 41 | 0 | 12 | |
| GSE60625 | MECOM | 2122 | 0 | 6 | 5 | |
| GSE74703 | MECOM | 2122 | 20 | 0 | 16 | |
| GSE74704 | MECOM | 2122 | 15 | 0 | 5 | |
| TCGA | MECOM | 2122 | 79 | 0 | 17 |
Total number of gains: 272; Total number of losses: 23; Total Number of normals: 193.
Somatic mutations of MECOM:
Generating mutation plots.
Highly correlated genes for MECOM:
Showing top 20/1311 corelated genes with mean PCC>0.5.
| Gene1 | Gene2 | Mean PCC | Num. Datasets | Num. PCC<0 | Num. PCC>0.5 |
|---|---|---|---|---|---|
| MECOM | FAM3B | 0.773571 | 6 | 0 | 6 |
| MECOM | MUC20 | 0.766658 | 8 | 0 | 8 |
| MECOM | SLC10A5 | 0.734638 | 3 | 0 | 3 |
| MECOM | RBM20 | 0.734466 | 4 | 0 | 4 |
| MECOM | HDHD2 | 0.715719 | 4 | 0 | 4 |
| MECOM | VSIG2 | 0.713644 | 6 | 0 | 6 |
| MECOM | SRGAP1 | 0.71316 | 3 | 0 | 3 |
| MECOM | CYP3A5 | 0.709914 | 9 | 0 | 9 |
| MECOM | CTTNBP2 | 0.705694 | 6 | 0 | 6 |
| MECOM | MACC1 | 0.705046 | 6 | 0 | 6 |
| MECOM | CAPN14 | 0.701444 | 5 | 0 | 5 |
| MECOM | FCHO2 | 0.698524 | 6 | 0 | 6 |
| MECOM | HPGD | 0.697416 | 12 | 0 | 12 |
| MECOM | FMO2 | 0.696263 | 10 | 0 | 10 |
| MECOM | SSNA1 | 0.696124 | 3 | 0 | 3 |
| MECOM | MBNL3 | 0.695924 | 6 | 0 | 5 |
| MECOM | SPAG17 | 0.694778 | 4 | 0 | 3 |
| MECOM | SH3BGRL2 | 0.694209 | 8 | 0 | 7 |
| MECOM | FAM3D | 0.693955 | 6 | 0 | 6 |
| MECOM | FAM214A | 0.692866 | 6 | 0 | 5 |
For details and further investigation, click here