| Full name: MKS transition zone complex subunit 1 | Alias Symbol: FLJ20345|POC12|BBS13 | ||
| Type: protein-coding gene | Cytoband: 17q22 | ||
| Entrez ID: 54903 | HGNC ID: HGNC:7121 | Ensembl Gene: ENSG00000011143 | OMIM ID: 609883 |
Expression of MKS1:
| Dataset | Gene | EntrezID | Probe | Log2FC | Adj.pValue | Expression |
|---|---|---|---|---|---|---|
| GSE17351 | MKS1 | 54903 | 1555820_a_at | -0.0368 | 0.9479 | |
| GSE20347 | MKS1 | 54903 | 218630_at | 0.1520 | 0.2849 | |
| GSE23400 | MKS1 | 54903 | 218630_at | 0.0963 | 0.0389 | |
| GSE26886 | MKS1 | 54903 | 1555820_a_at | -0.4162 | 0.0004 | |
| GSE29001 | MKS1 | 54903 | 218630_at | -0.1000 | 0.6384 | |
| GSE38129 | MKS1 | 54903 | 218630_at | 0.1729 | 0.0796 | |
| GSE45670 | MKS1 | 54903 | 218630_at | 0.1812 | 0.0288 | |
| GSE53622 | MKS1 | 54903 | 89184 | 0.4295 | 0.0000 | |
| GSE53624 | MKS1 | 54903 | 89184 | 0.4071 | 0.0000 | |
| GSE63941 | MKS1 | 54903 | 1555820_a_at | 0.6691 | 0.0073 | |
| GSE77861 | MKS1 | 54903 | 218630_at | -0.1540 | 0.3981 | |
| GSE97050 | MKS1 | 54903 | A_24_P330796 | 0.2783 | 0.3903 | |
| SRP007169 | MKS1 | 54903 | RNAseq | 0.3532 | 0.3857 | |
| SRP008496 | MKS1 | 54903 | RNAseq | -0.0513 | 0.8682 | |
| SRP064894 | MKS1 | 54903 | RNAseq | 0.3541 | 0.0129 | |
| SRP133303 | MKS1 | 54903 | RNAseq | 0.2911 | 0.1074 | |
| SRP159526 | MKS1 | 54903 | RNAseq | 0.5582 | 0.1465 | |
| SRP193095 | MKS1 | 54903 | RNAseq | -0.0287 | 0.7759 | |
| SRP219564 | MKS1 | 54903 | RNAseq | 0.4360 | 0.2239 | |
| TCGA | MKS1 | 54903 | RNAseq | 0.1538 | 0.0184 |
Upregulated datasets: 0; Downregulated datasets: 0.
Survival by MKS1 expression:
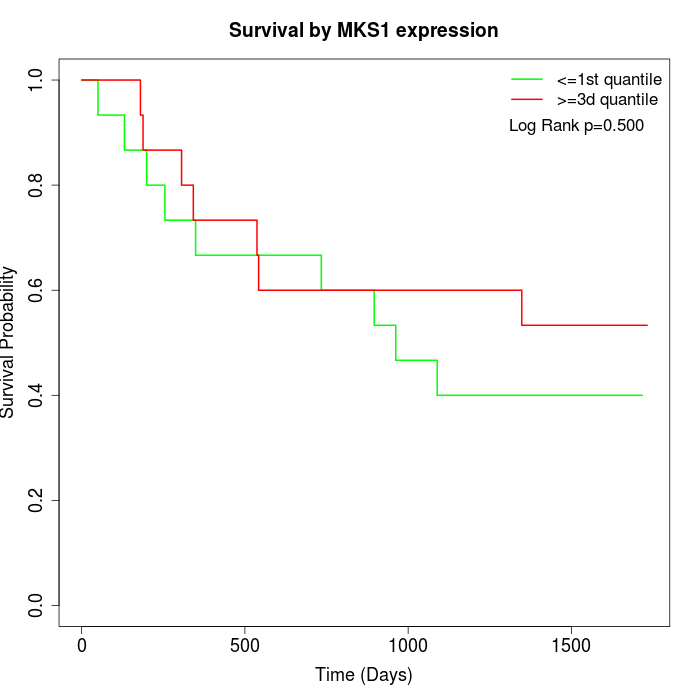 | 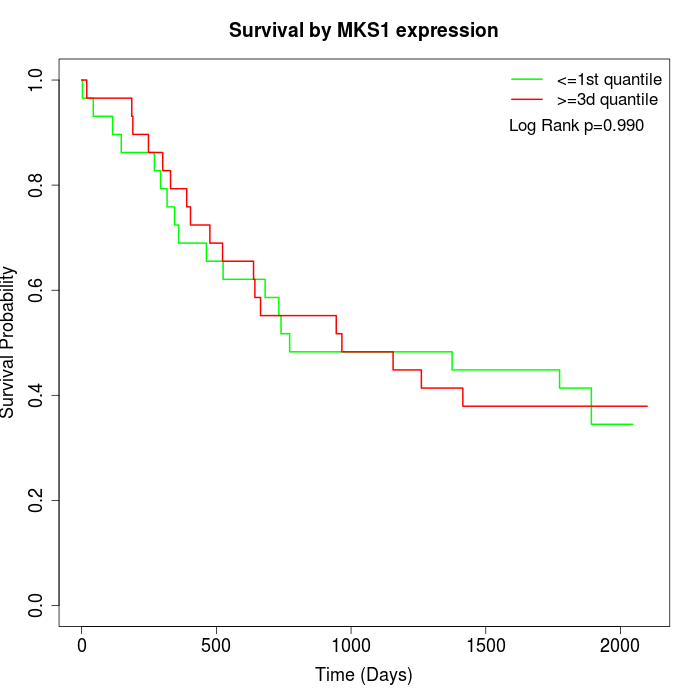 | 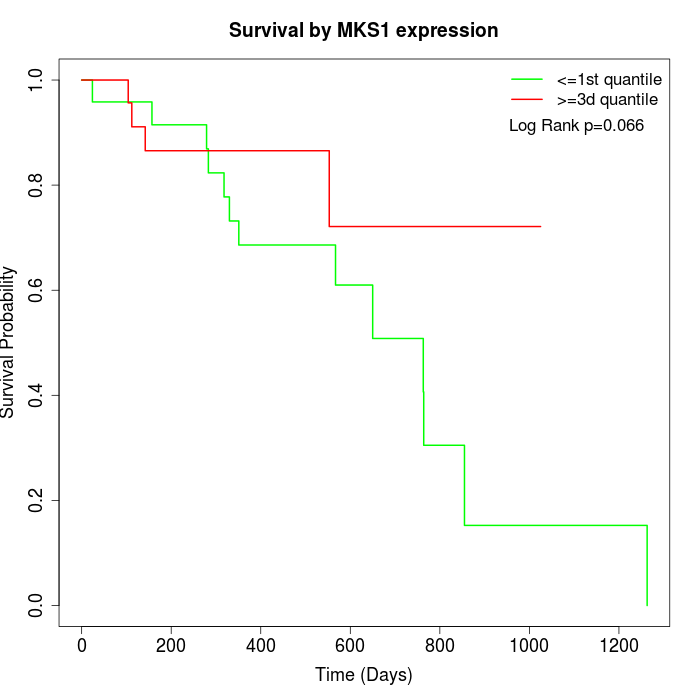 |
| GSE53622 | GSE53624 | TCGA |
Note: Click image to view full size file.
Copy number change of MKS1:
| Dataset | Gene | EntrezID | Gain | Loss | Normal | Detail |
|---|---|---|---|---|---|---|
| GSE15526 | MKS1 | 54903 | 5 | 1 | 24 | |
| GSE20123 | MKS1 | 54903 | 5 | 1 | 24 | |
| GSE43470 | MKS1 | 54903 | 4 | 0 | 39 | |
| GSE46452 | MKS1 | 54903 | 32 | 0 | 27 | |
| GSE47630 | MKS1 | 54903 | 7 | 1 | 32 | |
| GSE54993 | MKS1 | 54903 | 2 | 5 | 63 | |
| GSE54994 | MKS1 | 54903 | 8 | 6 | 39 | |
| GSE60625 | MKS1 | 54903 | 4 | 0 | 7 | |
| GSE74703 | MKS1 | 54903 | 4 | 0 | 32 | |
| GSE74704 | MKS1 | 54903 | 4 | 1 | 15 | |
| TCGA | MKS1 | 54903 | 26 | 8 | 62 |
Total number of gains: 101; Total number of losses: 23; Total Number of normals: 364.
Somatic mutations of MKS1:
Generating mutation plots.
Highly correlated genes for MKS1:
Showing top 20/330 corelated genes with mean PCC>0.5.
| Gene1 | Gene2 | Mean PCC | Num. Datasets | Num. PCC<0 | Num. PCC>0.5 |
|---|---|---|---|---|---|
| MKS1 | HHLA1 | 0.783111 | 3 | 0 | 3 |
| MKS1 | MIF4GD | 0.780135 | 3 | 0 | 3 |
| MKS1 | PITHD1 | 0.760508 | 3 | 0 | 3 |
| MKS1 | TMEM219 | 0.751614 | 3 | 0 | 3 |
| MKS1 | MRM1 | 0.73729 | 3 | 0 | 3 |
| MKS1 | PIGN | 0.734716 | 3 | 0 | 3 |
| MKS1 | VPS25 | 0.728027 | 3 | 0 | 3 |
| MKS1 | PRKAB1 | 0.723581 | 3 | 0 | 3 |
| MKS1 | NAIF1 | 0.710553 | 3 | 0 | 3 |
| MKS1 | SLC35B2 | 0.708846 | 3 | 0 | 3 |
| MKS1 | OPHN1 | 0.708574 | 4 | 0 | 4 |
| MKS1 | TM7SF2 | 0.706419 | 3 | 0 | 3 |
| MKS1 | ZC3HC1 | 0.702101 | 3 | 0 | 3 |
| MKS1 | CXCR5 | 0.701002 | 3 | 0 | 3 |
| MKS1 | TAF1L | 0.700742 | 3 | 0 | 3 |
| MKS1 | CXCL16 | 0.69415 | 3 | 0 | 3 |
| MKS1 | LMBR1 | 0.691436 | 4 | 0 | 4 |
| MKS1 | QTRT1 | 0.690956 | 3 | 0 | 3 |
| MKS1 | AKR1A1 | 0.68761 | 3 | 0 | 3 |
| MKS1 | RBL1 | 0.687419 | 4 | 0 | 3 |
For details and further investigation, click here