| Full name: musculin | Alias Symbol: ABF-1|bHLHa22 | ||
| Type: protein-coding gene | Cytoband: 8q13.3 | ||
| Entrez ID: 9242 | HGNC ID: HGNC:7321 | Ensembl Gene: ENSG00000178860 | OMIM ID: 603628 |
Expression of MSC:
| Dataset | Gene | EntrezID | Probe | Log2FC | Adj.pValue | Expression |
|---|---|---|---|---|---|---|
| GSE17351 | MSC | 9242 | 209928_s_at | 0.5233 | 0.5065 | |
| GSE20347 | MSC | 9242 | 209928_s_at | 0.3064 | 0.0118 | |
| GSE23400 | MSC | 9242 | 209928_s_at | 0.1742 | 0.0063 | |
| GSE26886 | MSC | 9242 | 209928_s_at | 0.4992 | 0.0091 | |
| GSE29001 | MSC | 9242 | 209928_s_at | 0.0608 | 0.6865 | |
| GSE38129 | MSC | 9242 | 209928_s_at | 0.4044 | 0.0020 | |
| GSE45670 | MSC | 9242 | 209928_s_at | 0.1733 | 0.3727 | |
| GSE53622 | MSC | 9242 | 14715 | 1.6576 | 0.0000 | |
| GSE53624 | MSC | 9242 | 14715 | 2.0571 | 0.0000 | |
| GSE63941 | MSC | 9242 | 209928_s_at | -0.8102 | 0.1872 | |
| GSE77861 | MSC | 9242 | 209928_s_at | 0.0729 | 0.6282 | |
| GSE97050 | MSC | 9242 | A_23_P256948 | 0.8609 | 0.0820 | |
| SRP007169 | MSC | 9242 | RNAseq | 2.9637 | 0.0065 | |
| SRP064894 | MSC | 9242 | RNAseq | 1.7343 | 0.0000 | |
| SRP133303 | MSC | 9242 | RNAseq | 1.6462 | 0.0000 | |
| SRP159526 | MSC | 9242 | RNAseq | 1.4955 | 0.0001 | |
| SRP219564 | MSC | 9242 | RNAseq | 2.0602 | 0.0002 | |
| TCGA | MSC | 9242 | RNAseq | 0.7959 | 0.0001 |
Upregulated datasets: 7; Downregulated datasets: 0.
Survival by MSC expression:
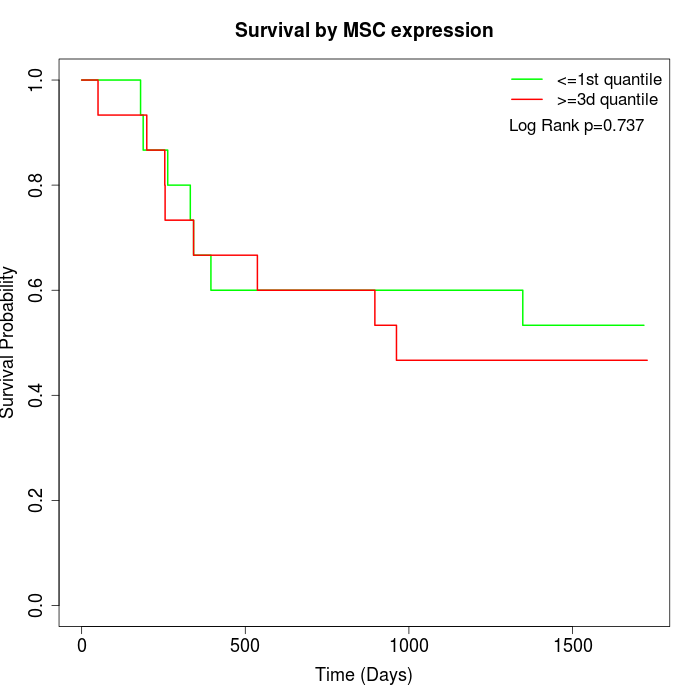 |  |  |
| GSE53622 | GSE53624 | TCGA |
Note: Click image to view full size file.
Copy number change of MSC:
| Dataset | Gene | EntrezID | Gain | Loss | Normal | Detail |
|---|---|---|---|---|---|---|
| GSE15526 | MSC | 9242 | 15 | 1 | 14 | |
| GSE20123 | MSC | 9242 | 16 | 1 | 13 | |
| GSE43470 | MSC | 9242 | 18 | 1 | 24 | |
| GSE46452 | MSC | 9242 | 20 | 2 | 37 | |
| GSE47630 | MSC | 9242 | 23 | 0 | 17 | |
| GSE54993 | MSC | 9242 | 0 | 19 | 51 | |
| GSE54994 | MSC | 9242 | 30 | 0 | 23 | |
| GSE60625 | MSC | 9242 | 0 | 4 | 7 | |
| GSE74703 | MSC | 9242 | 15 | 1 | 20 | |
| GSE74704 | MSC | 9242 | 11 | 0 | 9 | |
| TCGA | MSC | 9242 | 51 | 2 | 43 |
Total number of gains: 199; Total number of losses: 31; Total Number of normals: 258.
Somatic mutations of MSC:
Generating mutation plots.
Highly correlated genes for MSC:
Showing top 20/878 corelated genes with mean PCC>0.5.
| Gene1 | Gene2 | Mean PCC | Num. Datasets | Num. PCC<0 | Num. PCC>0.5 |
|---|---|---|---|---|---|
| MSC | HAS2 | 0.758824 | 8 | 0 | 8 |
| MSC | LRRC8C | 0.745932 | 3 | 0 | 3 |
| MSC | FCGR3A | 0.735941 | 3 | 0 | 3 |
| MSC | FAM89A | 0.731009 | 3 | 0 | 3 |
| MSC | PDIA5 | 0.726047 | 3 | 0 | 3 |
| MSC | PIM2 | 0.724535 | 3 | 0 | 3 |
| MSC | NNMT | 0.712684 | 3 | 0 | 3 |
| MSC | SPON2 | 0.708913 | 3 | 0 | 3 |
| MSC | SNAP47 | 0.701901 | 3 | 0 | 3 |
| MSC | PYCR2 | 0.699967 | 4 | 0 | 4 |
| MSC | GPX8 | 0.697472 | 4 | 0 | 4 |
| MSC | TRABD2A | 0.695365 | 3 | 0 | 3 |
| MSC | PIK3AP1 | 0.691441 | 4 | 0 | 4 |
| MSC | SLC17A9 | 0.690393 | 5 | 0 | 5 |
| MSC | SLC35B2 | 0.689626 | 3 | 0 | 3 |
| MSC | MTBP | 0.68512 | 3 | 0 | 3 |
| MSC | FUCA2 | 0.684679 | 3 | 0 | 3 |
| MSC | CCL21 | 0.6812 | 3 | 0 | 3 |
| MSC | RAB34 | 0.680405 | 3 | 0 | 3 |
| MSC | HAUS1 | 0.677399 | 3 | 0 | 3 |
For details and further investigation, click here