| Full name: metallothionein 1M | Alias Symbol: | ||
| Type: protein-coding gene | Cytoband: 16q13 | ||
| Entrez ID: 4499 | HGNC ID: HGNC:14296 | Ensembl Gene: ENSG00000205364 | OMIM ID: 156357 |
Expression of MT1M:
| Dataset | Gene | EntrezID | Probe | Log2FC | Adj.pValue | Expression |
|---|---|---|---|---|---|---|
| GSE17351 | MT1M | 4499 | 217546_at | -2.1535 | 0.1159 | |
| GSE20347 | MT1M | 4499 | 217546_at | -0.3936 | 0.3080 | |
| GSE23400 | MT1M | 4499 | 217546_at | -1.1707 | 0.0000 | |
| GSE26886 | MT1M | 4499 | 217546_at | 0.2000 | 0.7930 | |
| GSE29001 | MT1M | 4499 | 217546_at | -0.3628 | 0.4212 | |
| GSE38129 | MT1M | 4499 | 217546_at | -1.5679 | 0.0060 | |
| GSE45670 | MT1M | 4499 | 217546_at | -3.0152 | 0.0000 | |
| GSE53622 | MT1M | 4499 | 49291 | -1.5595 | 0.0000 | |
| GSE53624 | MT1M | 4499 | 49291 | -0.8353 | 0.0000 | |
| GSE63941 | MT1M | 4499 | 217546_at | -0.8188 | 0.2630 | |
| GSE77861 | MT1M | 4499 | 217546_at | -0.7031 | 0.0425 | |
| GSE97050 | MT1M | 4499 | A_23_P66241 | -1.2563 | 0.0695 | |
| SRP064894 | MT1M | 4499 | RNAseq | -1.2391 | 0.0443 | |
| SRP133303 | MT1M | 4499 | RNAseq | -1.8699 | 0.0036 | |
| SRP159526 | MT1M | 4499 | RNAseq | -0.9472 | 0.2975 | |
| SRP219564 | MT1M | 4499 | RNAseq | -1.8556 | 0.0463 | |
| TCGA | MT1M | 4499 | RNAseq | -2.2755 | 0.0000 |
Upregulated datasets: 0; Downregulated datasets: 8.
Survival by MT1M expression:
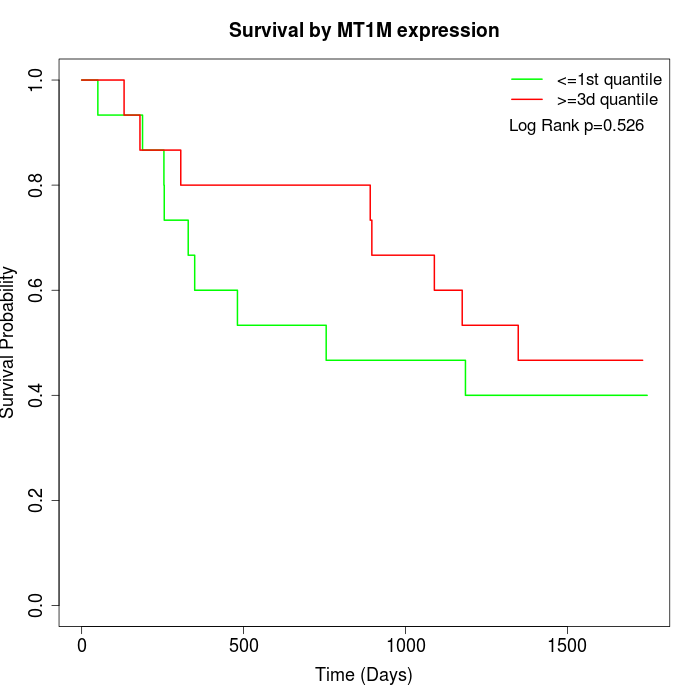 | 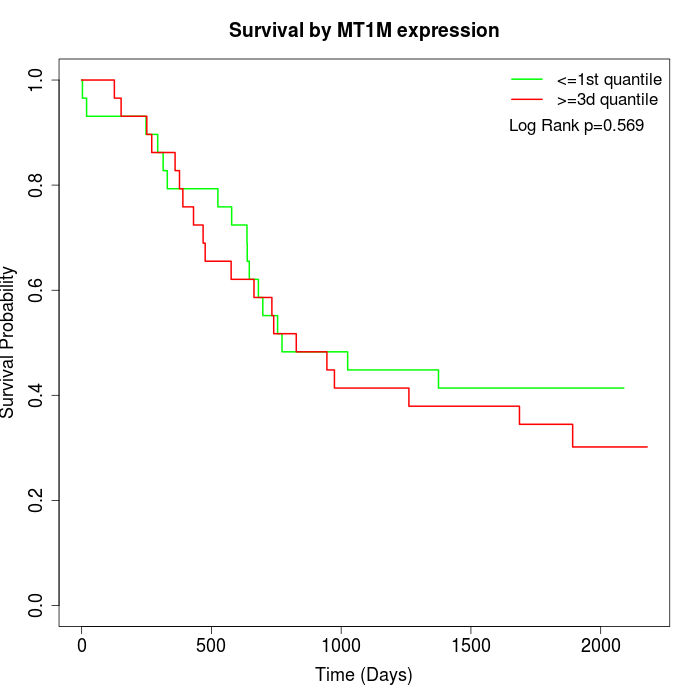 | 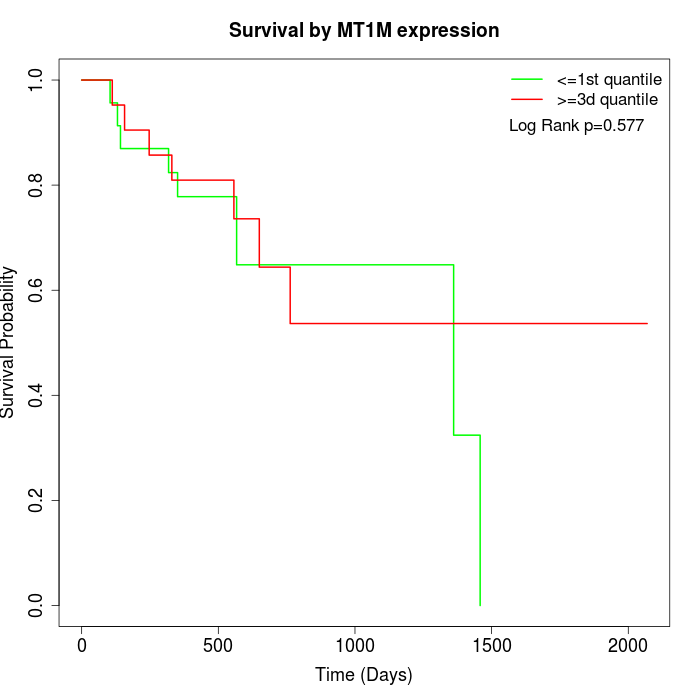 |
| GSE53622 | GSE53624 | TCGA |
Note: Click image to view full size file.
Copy number change of MT1M:
| Dataset | Gene | EntrezID | Gain | Loss | Normal | Detail |
|---|---|---|---|---|---|---|
| GSE15526 | MT1M | 4499 | 5 | 0 | 25 | |
| GSE20123 | MT1M | 4499 | 5 | 1 | 24 | |
| GSE43470 | MT1M | 4499 | 2 | 7 | 34 | |
| GSE46452 | MT1M | 4499 | 38 | 1 | 20 | |
| GSE47630 | MT1M | 4499 | 10 | 8 | 22 | |
| GSE54993 | MT1M | 4499 | 2 | 4 | 64 | |
| GSE54994 | MT1M | 4499 | 7 | 10 | 36 | |
| GSE60625 | MT1M | 4499 | 4 | 0 | 7 | |
| GSE74703 | MT1M | 4499 | 2 | 4 | 30 | |
| GSE74704 | MT1M | 4499 | 4 | 0 | 16 | |
| TCGA | MT1M | 4499 | 25 | 12 | 59 |
Total number of gains: 104; Total number of losses: 47; Total Number of normals: 337.
Somatic mutations of MT1M:
Generating mutation plots.
Highly correlated genes for MT1M:
Showing top 20/736 corelated genes with mean PCC>0.5.
| Gene1 | Gene2 | Mean PCC | Num. Datasets | Num. PCC<0 | Num. PCC>0.5 |
|---|---|---|---|---|---|
| MT1M | B3GALT2 | 0.743011 | 3 | 0 | 3 |
| MT1M | MT1B | 0.74088 | 3 | 0 | 3 |
| MT1M | TIFA | 0.737364 | 3 | 0 | 3 |
| MT1M | EIF4E3 | 0.732565 | 5 | 0 | 5 |
| MT1M | SNORA68 | 0.698013 | 3 | 0 | 3 |
| MT1M | FAM83D | 0.691004 | 3 | 0 | 3 |
| MT1M | LIFR | 0.690096 | 6 | 0 | 6 |
| MT1M | SLC4A4 | 0.689732 | 5 | 0 | 5 |
| MT1M | MT1E | 0.688695 | 12 | 0 | 11 |
| MT1M | EPG5 | 0.685638 | 4 | 0 | 4 |
| MT1M | TAGLN3 | 0.685537 | 3 | 0 | 3 |
| MT1M | LRRK2 | 0.681881 | 6 | 0 | 6 |
| MT1M | SOCS2 | 0.680031 | 5 | 0 | 5 |
| MT1M | RNPC3 | 0.679661 | 3 | 0 | 3 |
| MT1M | XKR4 | 0.679537 | 4 | 0 | 4 |
| MT1M | PRKAA2 | 0.676312 | 4 | 0 | 3 |
| MT1M | ASPA | 0.672993 | 7 | 0 | 7 |
| MT1M | PSIP1 | 0.671087 | 3 | 0 | 3 |
| MT1M | PLAC9 | 0.67059 | 4 | 0 | 4 |
| MT1M | ANGPTL1 | 0.67012 | 4 | 0 | 3 |
For details and further investigation, click here