| Full name: N-acetyltransferase 1 | Alias Symbol: | ||
| Type: protein-coding gene | Cytoband: 8p22 | ||
| Entrez ID: 9 | HGNC ID: HGNC:7645 | Ensembl Gene: ENSG00000171428 | OMIM ID: 108345 |
| Related drugs: 5-METHOXYTRYPTAMINE, AMITRIPTYLINE HYDROCHLORIDE, AMOXAPINE, AMPHETAMINE, AMPHETAMINE ADIPATE, AMPHETAMINE ASPARTATE, AMPHETAMINE SULFATE, ASPIRIN, ATOMOXETINE HYDROCHLORIDE, BACLOFEN... [more] | |||
Expression of NAT1:
| Dataset | Gene | EntrezID | Probe | Log2FC | Adj.pValue | Expression |
|---|---|---|---|---|---|---|
| GSE17351 | NAT1 | 9 | 214440_at | 0.3007 | 0.7330 | |
| GSE20347 | NAT1 | 9 | 214440_at | -0.2621 | 0.3305 | |
| GSE23400 | NAT1 | 9 | 214440_at | 0.1191 | 0.0740 | |
| GSE26886 | NAT1 | 9 | 214440_at | -1.8131 | 0.0003 | |
| GSE29001 | NAT1 | 9 | 214440_at | -0.1808 | 0.6697 | |
| GSE38129 | NAT1 | 9 | 214440_at | -0.0574 | 0.8352 | |
| GSE45670 | NAT1 | 9 | 214440_at | 0.6507 | 0.0108 | |
| GSE53622 | NAT1 | 9 | 66728 | 0.1136 | 0.1191 | |
| GSE53624 | NAT1 | 9 | 126762 | -0.0179 | 0.8719 | |
| GSE63941 | NAT1 | 9 | 214440_at | -0.2109 | 0.8433 | |
| GSE77861 | NAT1 | 9 | 214440_at | -0.5378 | 0.3092 | |
| GSE97050 | NAT1 | 9 | A_23_P95594 | 0.8406 | 0.1908 | |
| SRP007169 | NAT1 | 9 | RNAseq | 0.3312 | 0.5023 | |
| SRP064894 | NAT1 | 9 | RNAseq | -0.2621 | 0.3476 | |
| SRP133303 | NAT1 | 9 | RNAseq | 0.3074 | 0.1729 | |
| SRP159526 | NAT1 | 9 | RNAseq | -0.8015 | 0.1035 | |
| SRP193095 | NAT1 | 9 | RNAseq | -1.0645 | 0.0001 | |
| SRP219564 | NAT1 | 9 | RNAseq | -0.2768 | 0.4986 | |
| TCGA | NAT1 | 9 | RNAseq | -0.3382 | 0.0183 |
Upregulated datasets: 0; Downregulated datasets: 2.
Survival by NAT1 expression:
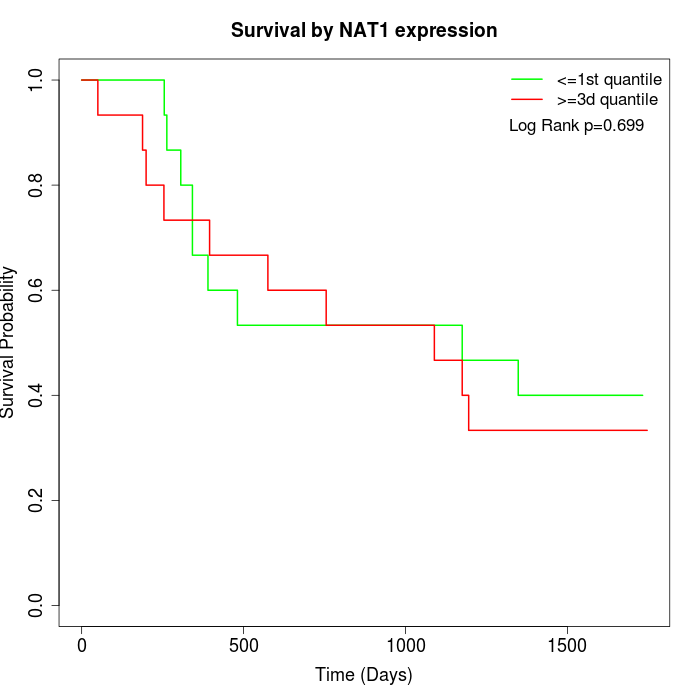 | 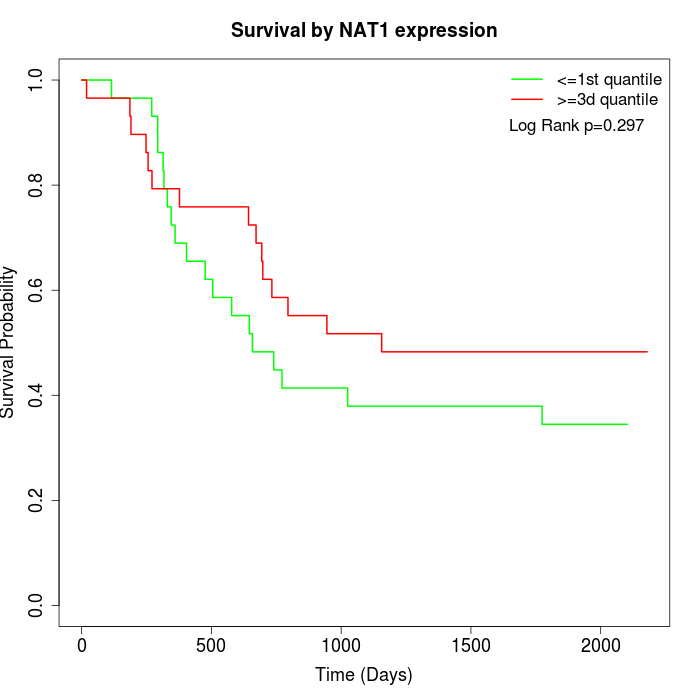 | 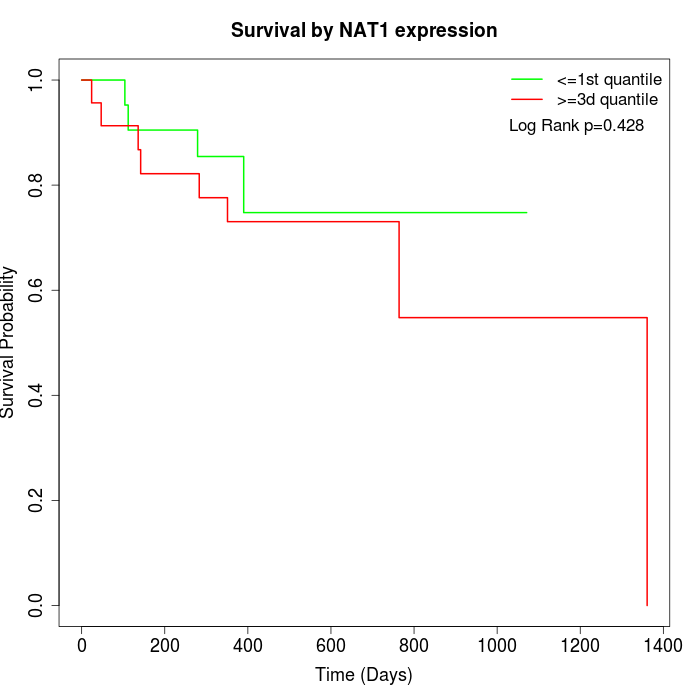 |
| GSE53622 | GSE53624 | TCGA |
Note: Click image to view full size file.
Copy number change of NAT1:
| Dataset | Gene | EntrezID | Gain | Loss | Normal | Detail |
|---|---|---|---|---|---|---|
| GSE15526 | NAT1 | 9 | 3 | 10 | 17 | |
| GSE20123 | NAT1 | 9 | 4 | 10 | 16 | |
| GSE43470 | NAT1 | 9 | 4 | 8 | 31 | |
| GSE46452 | NAT1 | 9 | 14 | 13 | 32 | |
| GSE47630 | NAT1 | 9 | 10 | 8 | 22 | |
| GSE54993 | NAT1 | 9 | 2 | 14 | 54 | |
| GSE54994 | NAT1 | 9 | 8 | 18 | 27 | |
| GSE60625 | NAT1 | 9 | 3 | 0 | 8 | |
| GSE74703 | NAT1 | 9 | 4 | 7 | 25 | |
| GSE74704 | NAT1 | 9 | 3 | 7 | 10 | |
| TCGA | NAT1 | 9 | 14 | 41 | 41 |
Total number of gains: 69; Total number of losses: 136; Total Number of normals: 283.
Somatic mutations of NAT1:
Generating mutation plots.
Highly correlated genes for NAT1:
Showing top 20/573 corelated genes with mean PCC>0.5.
| Gene1 | Gene2 | Mean PCC | Num. Datasets | Num. PCC<0 | Num. PCC>0.5 |
|---|---|---|---|---|---|
| NAT1 | FRMD8 | 0.828923 | 3 | 0 | 3 |
| NAT1 | UNC5B | 0.800606 | 3 | 0 | 3 |
| NAT1 | SPIN4 | 0.765977 | 3 | 0 | 3 |
| NAT1 | LACTB | 0.759991 | 3 | 0 | 3 |
| NAT1 | DNAJB6 | 0.739645 | 3 | 0 | 3 |
| NAT1 | PAPSS2 | 0.734444 | 3 | 0 | 3 |
| NAT1 | KDM2B | 0.733051 | 3 | 0 | 3 |
| NAT1 | LYSMD3 | 0.732405 | 3 | 0 | 3 |
| NAT1 | SEMA4D | 0.726092 | 3 | 0 | 3 |
| NAT1 | GK5 | 0.724319 | 3 | 0 | 3 |
| NAT1 | TET2 | 0.716576 | 4 | 0 | 4 |
| NAT1 | SUCLG1 | 0.713969 | 3 | 0 | 3 |
| NAT1 | GTF2A1 | 0.712029 | 3 | 0 | 3 |
| NAT1 | CDKN2C | 0.708171 | 3 | 0 | 3 |
| NAT1 | WDFY1 | 0.706802 | 3 | 0 | 3 |
| NAT1 | BROX | 0.705625 | 3 | 0 | 3 |
| NAT1 | RASA2 | 0.704234 | 3 | 0 | 3 |
| NAT1 | NDFIP2 | 0.702025 | 4 | 0 | 4 |
| NAT1 | USP38 | 0.69591 | 4 | 0 | 4 |
| NAT1 | FRMD6 | 0.688688 | 3 | 0 | 3 |
For details and further investigation, click here