| Full name: NPC intracellular cholesterol transporter 1 | Alias Symbol: SLC65A1 | ||
| Type: protein-coding gene | Cytoband: 18q11.2 | ||
| Entrez ID: 4864 | HGNC ID: HGNC:7897 | Ensembl Gene: ENSG00000141458 | OMIM ID: 607623 |
Screen Evidence:
| |||
Expression of NPC1:
| Dataset | Gene | EntrezID | Probe | Log2FC | Adj.pValue | Expression |
|---|---|---|---|---|---|---|
| GSE17351 | NPC1 | 4864 | 202679_at | 0.1133 | 0.8774 | |
| GSE20347 | NPC1 | 4864 | 202679_at | -0.0386 | 0.8525 | |
| GSE23400 | NPC1 | 4864 | 202679_at | 0.1812 | 0.0520 | |
| GSE26886 | NPC1 | 4864 | 202679_at | -0.6441 | 0.0004 | |
| GSE29001 | NPC1 | 4864 | 202679_at | -0.2336 | 0.5025 | |
| GSE38129 | NPC1 | 4864 | 202679_at | 0.2756 | 0.1161 | |
| GSE45670 | NPC1 | 4864 | 202679_at | 0.3669 | 0.0461 | |
| GSE53622 | NPC1 | 4864 | 75547 | 0.3750 | 0.0000 | |
| GSE53624 | NPC1 | 4864 | 75547 | 0.3337 | 0.0000 | |
| GSE63941 | NPC1 | 4864 | 202679_at | -0.9750 | 0.0632 | |
| GSE77861 | NPC1 | 4864 | 202679_at | 0.5959 | 0.0257 | |
| GSE97050 | NPC1 | 4864 | A_23_P107587 | 0.5567 | 0.1623 | |
| SRP007169 | NPC1 | 4864 | RNAseq | 0.9482 | 0.0232 | |
| SRP008496 | NPC1 | 4864 | RNAseq | 0.6876 | 0.0136 | |
| SRP064894 | NPC1 | 4864 | RNAseq | -0.0600 | 0.8099 | |
| SRP133303 | NPC1 | 4864 | RNAseq | 0.4406 | 0.0338 | |
| SRP159526 | NPC1 | 4864 | RNAseq | 0.2693 | 0.4843 | |
| SRP193095 | NPC1 | 4864 | RNAseq | 0.2166 | 0.1124 | |
| SRP219564 | NPC1 | 4864 | RNAseq | 0.2344 | 0.5731 | |
| TCGA | NPC1 | 4864 | RNAseq | -0.0143 | 0.7862 |
Upregulated datasets: 0; Downregulated datasets: 0.
Survival by NPC1 expression:
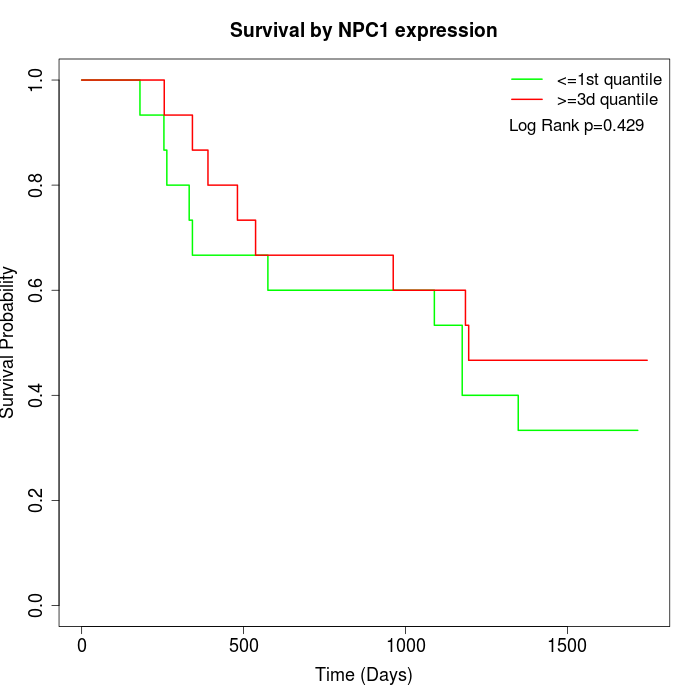 |  | 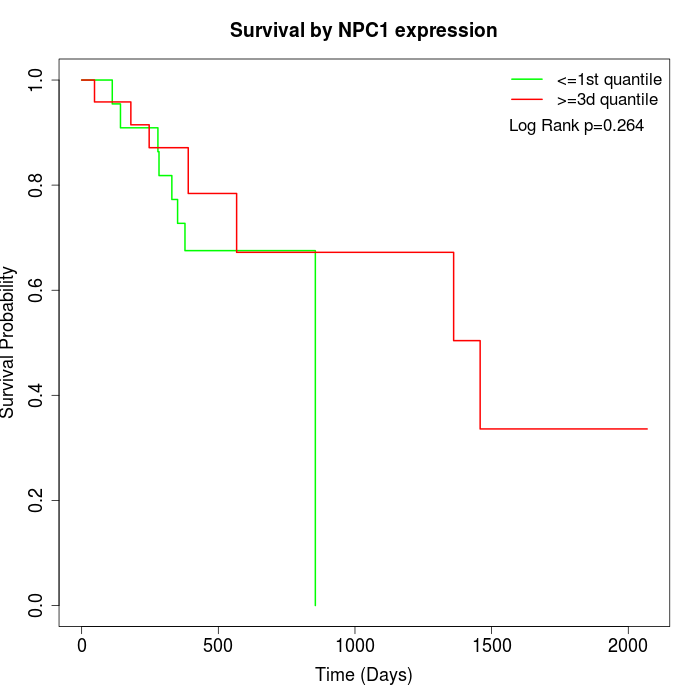 |
| GSE53622 | GSE53624 | TCGA |
Note: Click image to view full size file.
Copy number change of NPC1:
| Dataset | Gene | EntrezID | Gain | Loss | Normal | Detail |
|---|---|---|---|---|---|---|
| GSE15526 | NPC1 | 4864 | 2 | 5 | 23 | |
| GSE20123 | NPC1 | 4864 | 1 | 5 | 24 | |
| GSE43470 | NPC1 | 4864 | 2 | 1 | 40 | |
| GSE46452 | NPC1 | 4864 | 3 | 23 | 33 | |
| GSE47630 | NPC1 | 4864 | 7 | 18 | 15 | |
| GSE54993 | NPC1 | 4864 | 7 | 1 | 62 | |
| GSE54994 | NPC1 | 4864 | 4 | 12 | 37 | |
| GSE60625 | NPC1 | 4864 | 0 | 4 | 7 | |
| GSE74703 | NPC1 | 4864 | 2 | 1 | 33 | |
| GSE74704 | NPC1 | 4864 | 1 | 4 | 15 | |
| TCGA | NPC1 | 4864 | 14 | 25 | 57 |
Total number of gains: 43; Total number of losses: 99; Total Number of normals: 346.
Somatic mutations of NPC1:
Generating mutation plots.
Highly correlated genes for NPC1:
Showing top 20/136 corelated genes with mean PCC>0.5.
| Gene1 | Gene2 | Mean PCC | Num. Datasets | Num. PCC<0 | Num. PCC>0.5 |
|---|---|---|---|---|---|
| NPC1 | MLKL | 0.756553 | 3 | 0 | 3 |
| NPC1 | PRDM10 | 0.738038 | 3 | 0 | 3 |
| NPC1 | PTPRE | 0.706385 | 3 | 0 | 3 |
| NPC1 | SELE | 0.704946 | 3 | 0 | 3 |
| NPC1 | AGPAT5 | 0.697504 | 3 | 0 | 3 |
| NPC1 | ZBED6 | 0.684439 | 3 | 0 | 3 |
| NPC1 | GSDMC | 0.678166 | 3 | 0 | 3 |
| NPC1 | ALDH1A3 | 0.676998 | 3 | 0 | 3 |
| NPC1 | AKIRIN2 | 0.674095 | 5 | 0 | 4 |
| NPC1 | CRIPT | 0.671758 | 3 | 0 | 3 |
| NPC1 | THAP2 | 0.664433 | 3 | 0 | 3 |
| NPC1 | GAN | 0.660019 | 3 | 0 | 3 |
| NPC1 | RAB2A | 0.659565 | 4 | 0 | 3 |
| NPC1 | ALAS1 | 0.652975 | 4 | 0 | 3 |
| NPC1 | TBC1D20 | 0.648893 | 3 | 0 | 3 |
| NPC1 | WDR59 | 0.648388 | 4 | 0 | 4 |
| NPC1 | SRRD | 0.644423 | 4 | 0 | 3 |
| NPC1 | ARHGAP17 | 0.642536 | 4 | 0 | 3 |
| NPC1 | CXCL5 | 0.639673 | 4 | 0 | 3 |
| NPC1 | NPAS2 | 0.638634 | 4 | 0 | 4 |
For details and further investigation, click here