| Full name: olfactomedin like 2B | Alias Symbol: DKFZP586L151 | ||
| Type: protein-coding gene | Cytoband: 1q23.3 | ||
| Entrez ID: 25903 | HGNC ID: HGNC:24558 | Ensembl Gene: ENSG00000162745 | OMIM ID: |
Expression of OLFML2B:
| Dataset | Gene | EntrezID | Probe | Log2FC | Adj.pValue | Expression |
|---|---|---|---|---|---|---|
| GSE17351 | OLFML2B | 25903 | 213125_at | 1.4085 | 0.1327 | |
| GSE20347 | OLFML2B | 25903 | 213125_at | 0.9627 | 0.0000 | |
| GSE23400 | OLFML2B | 25903 | 213125_at | 0.9700 | 0.0000 | |
| GSE26886 | OLFML2B | 25903 | 213125_at | 0.8574 | 0.0018 | |
| GSE29001 | OLFML2B | 25903 | 213125_at | 1.2007 | 0.0010 | |
| GSE38129 | OLFML2B | 25903 | 213125_at | 1.2024 | 0.0000 | |
| GSE45670 | OLFML2B | 25903 | 213125_at | 0.7346 | 0.1206 | |
| GSE53622 | OLFML2B | 25903 | 50783 | 1.5406 | 0.0000 | |
| GSE53624 | OLFML2B | 25903 | 50783 | 1.3373 | 0.0000 | |
| GSE63941 | OLFML2B | 25903 | 213125_at | -1.3935 | 0.0000 | |
| GSE77861 | OLFML2B | 25903 | 213125_at | 0.2716 | 0.2715 | |
| GSE97050 | OLFML2B | 25903 | A_23_P137689 | 1.1609 | 0.1317 | |
| SRP007169 | OLFML2B | 25903 | RNAseq | 4.5244 | 0.0000 | |
| SRP008496 | OLFML2B | 25903 | RNAseq | 4.1147 | 0.0000 | |
| SRP064894 | OLFML2B | 25903 | RNAseq | 3.1766 | 0.0000 | |
| SRP133303 | OLFML2B | 25903 | RNAseq | 2.6208 | 0.0000 | |
| SRP159526 | OLFML2B | 25903 | RNAseq | 1.3225 | 0.0003 | |
| SRP193095 | OLFML2B | 25903 | RNAseq | 2.9706 | 0.0000 | |
| SRP219564 | OLFML2B | 25903 | RNAseq | 2.4682 | 0.0021 | |
| TCGA | OLFML2B | 25903 | RNAseq | 0.9010 | 0.0000 |
Upregulated datasets: 11; Downregulated datasets: 1.
Survival by OLFML2B expression:
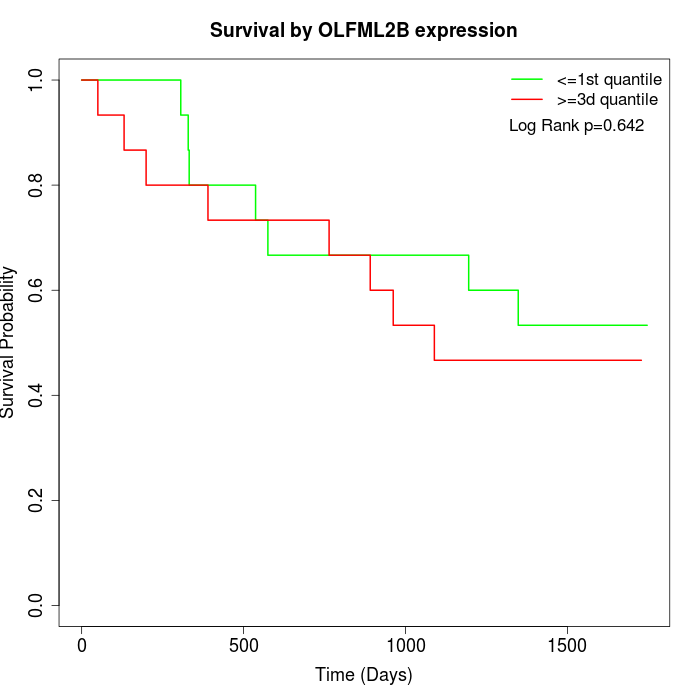 | 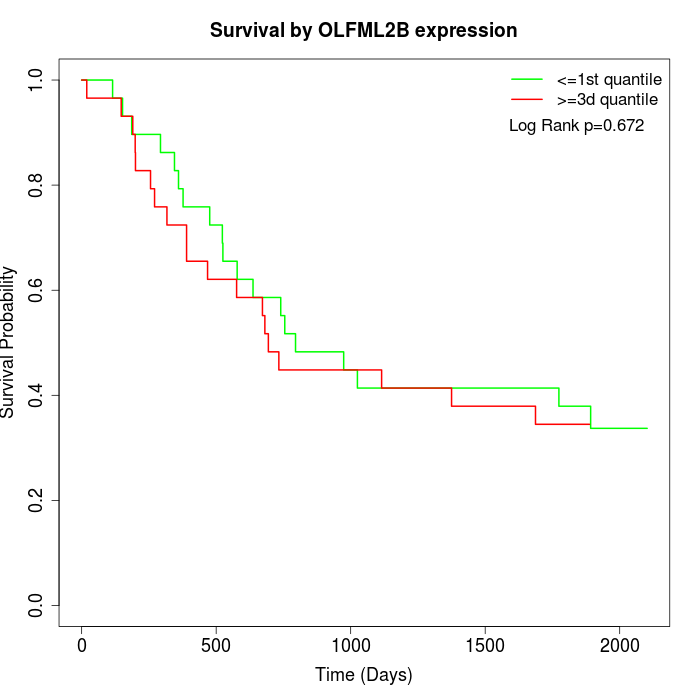 |  |
| GSE53622 | GSE53624 | TCGA |
Note: Click image to view full size file.
Copy number change of OLFML2B:
| Dataset | Gene | EntrezID | Gain | Loss | Normal | Detail |
|---|---|---|---|---|---|---|
| GSE15526 | OLFML2B | 25903 | 10 | 0 | 20 | |
| GSE20123 | OLFML2B | 25903 | 10 | 0 | 20 | |
| GSE43470 | OLFML2B | 25903 | 7 | 2 | 34 | |
| GSE46452 | OLFML2B | 25903 | 2 | 1 | 56 | |
| GSE47630 | OLFML2B | 25903 | 14 | 0 | 26 | |
| GSE54993 | OLFML2B | 25903 | 0 | 5 | 65 | |
| GSE54994 | OLFML2B | 25903 | 16 | 0 | 37 | |
| GSE60625 | OLFML2B | 25903 | 0 | 0 | 11 | |
| GSE74703 | OLFML2B | 25903 | 7 | 2 | 27 | |
| GSE74704 | OLFML2B | 25903 | 4 | 0 | 16 | |
| TCGA | OLFML2B | 25903 | 43 | 4 | 49 |
Total number of gains: 113; Total number of losses: 14; Total Number of normals: 361.
Somatic mutations of OLFML2B:
Generating mutation plots.
Highly correlated genes for OLFML2B:
Showing top 20/982 corelated genes with mean PCC>0.5.
| Gene1 | Gene2 | Mean PCC | Num. Datasets | Num. PCC<0 | Num. PCC>0.5 |
|---|---|---|---|---|---|
| OLFML2B | PCOLCE | 0.820673 | 13 | 0 | 13 |
| OLFML2B | THY1 | 0.814054 | 13 | 0 | 13 |
| OLFML2B | FAP | 0.809546 | 11 | 0 | 11 |
| OLFML2B | COL5A1 | 0.805515 | 13 | 0 | 13 |
| OLFML2B | COL6A3 | 0.800004 | 13 | 0 | 13 |
| OLFML2B | VCAN | 0.799935 | 13 | 0 | 13 |
| OLFML2B | COL1A2 | 0.794932 | 12 | 0 | 12 |
| OLFML2B | COL5A2 | 0.791769 | 13 | 0 | 13 |
| OLFML2B | CTSK | 0.790028 | 13 | 0 | 13 |
| OLFML2B | SPARC | 0.789723 | 13 | 0 | 13 |
| OLFML2B | SULF1 | 0.783414 | 12 | 0 | 12 |
| OLFML2B | POSTN | 0.778324 | 13 | 0 | 13 |
| OLFML2B | NOX4 | 0.777629 | 13 | 0 | 12 |
| OLFML2B | BGN | 0.76725 | 13 | 0 | 12 |
| OLFML2B | COL3A1 | 0.766477 | 13 | 0 | 13 |
| OLFML2B | CDH11 | 0.762568 | 13 | 0 | 13 |
| OLFML2B | COL1A1 | 0.75739 | 12 | 0 | 11 |
| OLFML2B | INHBA | 0.752971 | 12 | 0 | 12 |
| OLFML2B | NID2 | 0.751523 | 10 | 0 | 8 |
| OLFML2B | MFAP2 | 0.746469 | 12 | 0 | 12 |
For details and further investigation, click here