| Full name: programmed cell death 10 | Alias Symbol: TFAR15 | ||
| Type: protein-coding gene | Cytoband: 3q26.1 | ||
| Entrez ID: 11235 | HGNC ID: HGNC:8761 | Ensembl Gene: ENSG00000114209 | OMIM ID: 609118 |
Screen Evidence:
| |||
Expression of PDCD10:
| Dataset | Gene | EntrezID | Probe | Log2FC | Adj.pValue | Expression |
|---|---|---|---|---|---|---|
| GSE17351 | PDCD10 | 11235 | 210907_s_at | 0.2798 | 0.3168 | |
| GSE20347 | PDCD10 | 11235 | 210907_s_at | 0.2621 | 0.0871 | |
| GSE23400 | PDCD10 | 11235 | 210907_s_at | 0.2966 | 0.0002 | |
| GSE26886 | PDCD10 | 11235 | 210907_s_at | 0.3219 | 0.0496 | |
| GSE29001 | PDCD10 | 11235 | 210907_s_at | 0.2171 | 0.7330 | |
| GSE38129 | PDCD10 | 11235 | 210907_s_at | 0.4507 | 0.0011 | |
| GSE45670 | PDCD10 | 11235 | 210907_s_at | 0.2582 | 0.1344 | |
| GSE53622 | PDCD10 | 11235 | 64155 | 0.2135 | 0.0011 | |
| GSE53624 | PDCD10 | 11235 | 64155 | 0.2450 | 0.0016 | |
| GSE63941 | PDCD10 | 11235 | 210907_s_at | 1.1307 | 0.0119 | |
| GSE77861 | PDCD10 | 11235 | 210907_s_at | -0.0375 | 0.9058 | |
| GSE97050 | PDCD10 | 11235 | A_23_P18325 | 0.4413 | 0.1772 | |
| SRP007169 | PDCD10 | 11235 | RNAseq | -0.3399 | 0.2872 | |
| SRP008496 | PDCD10 | 11235 | RNAseq | -0.1076 | 0.5934 | |
| SRP064894 | PDCD10 | 11235 | RNAseq | 0.0058 | 0.9792 | |
| SRP133303 | PDCD10 | 11235 | RNAseq | 0.6679 | 0.0003 | |
| SRP159526 | PDCD10 | 11235 | RNAseq | 0.3790 | 0.3868 | |
| SRP193095 | PDCD10 | 11235 | RNAseq | 0.0769 | 0.6201 | |
| SRP219564 | PDCD10 | 11235 | RNAseq | -0.3819 | 0.4340 | |
| TCGA | PDCD10 | 11235 | RNAseq | 0.2353 | 0.0000 |
Upregulated datasets: 1; Downregulated datasets: 0.
Survival by PDCD10 expression:
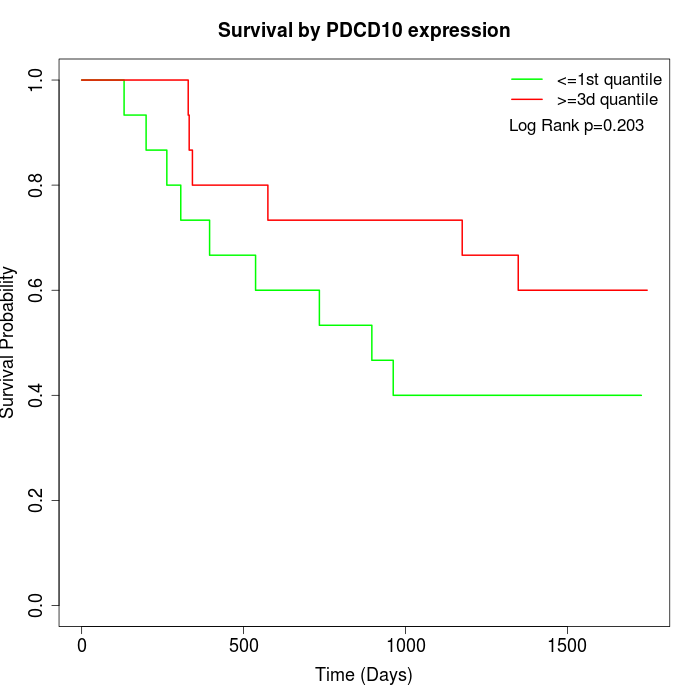 | 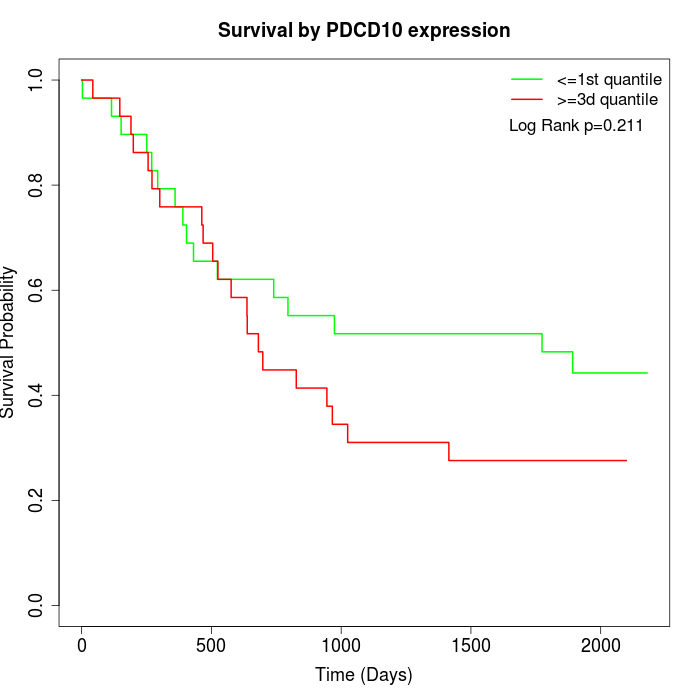 | 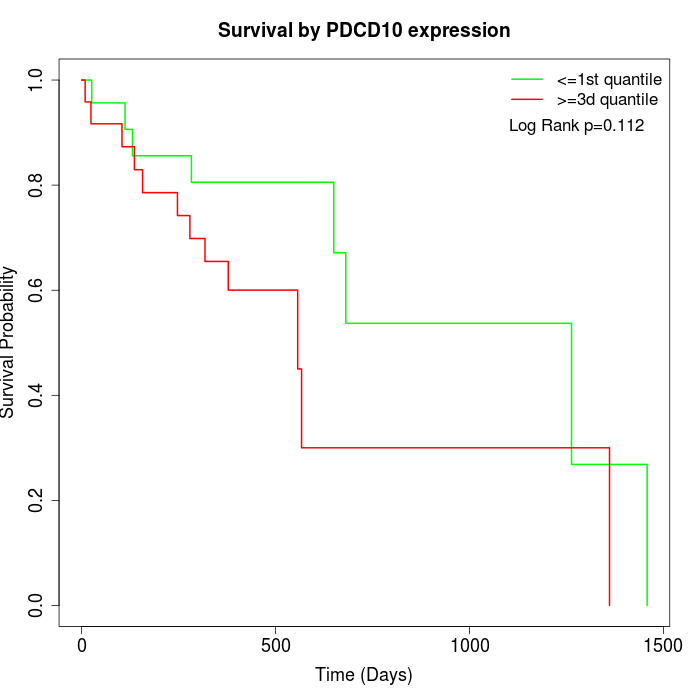 |
| GSE53622 | GSE53624 | TCGA |
Note: Click image to view full size file.
Copy number change of PDCD10:
| Dataset | Gene | EntrezID | Gain | Loss | Normal | Detail |
|---|---|---|---|---|---|---|
| GSE15526 | PDCD10 | 11235 | 22 | 0 | 8 | |
| GSE20123 | PDCD10 | 11235 | 22 | 0 | 8 | |
| GSE43470 | PDCD10 | 11235 | 23 | 0 | 20 | |
| GSE46452 | PDCD10 | 11235 | 19 | 1 | 39 | |
| GSE47630 | PDCD10 | 11235 | 27 | 2 | 11 | |
| GSE54993 | PDCD10 | 11235 | 1 | 13 | 56 | |
| GSE54994 | PDCD10 | 11235 | 41 | 0 | 12 | |
| GSE60625 | PDCD10 | 11235 | 0 | 6 | 5 | |
| GSE74703 | PDCD10 | 11235 | 19 | 0 | 17 | |
| GSE74704 | PDCD10 | 11235 | 14 | 0 | 6 | |
| TCGA | PDCD10 | 11235 | 79 | 0 | 17 |
Total number of gains: 267; Total number of losses: 22; Total Number of normals: 199.
Somatic mutations of PDCD10:
Generating mutation plots.
Highly correlated genes for PDCD10:
Showing top 20/757 corelated genes with mean PCC>0.5.
| Gene1 | Gene2 | Mean PCC | Num. Datasets | Num. PCC<0 | Num. PCC>0.5 |
|---|---|---|---|---|---|
| PDCD10 | PSPC1 | 0.717805 | 3 | 0 | 3 |
| PDCD10 | PHF14 | 0.673955 | 5 | 0 | 4 |
| PDCD10 | SRSF9 | 0.671439 | 3 | 0 | 3 |
| PDCD10 | TIMMDC1 | 0.67122 | 3 | 0 | 3 |
| PDCD10 | RCC2 | 0.669149 | 4 | 0 | 4 |
| PDCD10 | COPB2 | 0.665644 | 12 | 0 | 9 |
| PDCD10 | RPAP3 | 0.665222 | 8 | 0 | 7 |
| PDCD10 | CALML5 | 0.665025 | 3 | 0 | 3 |
| PDCD10 | NMD3 | 0.663941 | 13 | 0 | 13 |
| PDCD10 | FAM110A | 0.663512 | 3 | 0 | 3 |
| PDCD10 | NDUFB5 | 0.663245 | 9 | 0 | 7 |
| PDCD10 | UTP20 | 0.659414 | 3 | 0 | 3 |
| PDCD10 | ATG3 | 0.659283 | 11 | 0 | 8 |
| PDCD10 | CHML | 0.658353 | 3 | 0 | 3 |
| PDCD10 | CCNE1 | 0.655871 | 4 | 0 | 3 |
| PDCD10 | TXNDC9 | 0.655799 | 10 | 0 | 8 |
| PDCD10 | ABCF3 | 0.655711 | 8 | 0 | 6 |
| PDCD10 | CNOT10 | 0.65552 | 3 | 0 | 3 |
| PDCD10 | RASA2 | 0.654328 | 4 | 0 | 3 |
| PDCD10 | SIX4 | 0.654307 | 4 | 0 | 4 |
For details and further investigation, click here