| Full name: phosphodiesterase 11A | Alias Symbol: | ||
| Type: protein-coding gene | Cytoband: 2q31.2 | ||
| Entrez ID: 50940 | HGNC ID: HGNC:8773 | Ensembl Gene: ENSG00000128655 | OMIM ID: 604961 |
| Related drugs: TADALAFIL... [more] | |||
Expression of PDE11A:
| Dataset | Gene | EntrezID | Probe | Log2FC | Adj.pValue | Expression |
|---|---|---|---|---|---|---|
| GSE17351 | PDE11A | 50940 | 221110_x_at | 0.0992 | 0.6943 | |
| GSE20347 | PDE11A | 50940 | 221110_x_at | 0.1002 | 0.2300 | |
| GSE23400 | PDE11A | 50940 | 221110_x_at | -0.0724 | 0.0689 | |
| GSE26886 | PDE11A | 50940 | 221110_x_at | 0.1842 | 0.1098 | |
| GSE29001 | PDE11A | 50940 | 221110_x_at | 0.0363 | 0.8271 | |
| GSE38129 | PDE11A | 50940 | 221110_x_at | 0.0408 | 0.6548 | |
| GSE45670 | PDE11A | 50940 | 221110_x_at | 0.1497 | 0.1845 | |
| GSE53622 | PDE11A | 50940 | 64870 | 0.2401 | 0.2800 | |
| GSE53624 | PDE11A | 50940 | 36144 | 0.2880 | 0.2915 | |
| GSE63941 | PDE11A | 50940 | 221110_x_at | 0.2603 | 0.0840 | |
| GSE77861 | PDE11A | 50940 | 224223_s_at | -0.0282 | 0.8213 | |
| SRP133303 | PDE11A | 50940 | RNAseq | 0.3050 | 0.1822 | |
| SRP159526 | PDE11A | 50940 | RNAseq | 1.4826 | 0.0044 | |
| SRP193095 | PDE11A | 50940 | RNAseq | -0.1117 | 0.5203 | |
| SRP219564 | PDE11A | 50940 | RNAseq | 0.4653 | 0.3996 | |
| TCGA | PDE11A | 50940 | RNAseq | -1.1379 | 0.0541 |
Upregulated datasets: 1; Downregulated datasets: 0.
Survival by PDE11A expression:
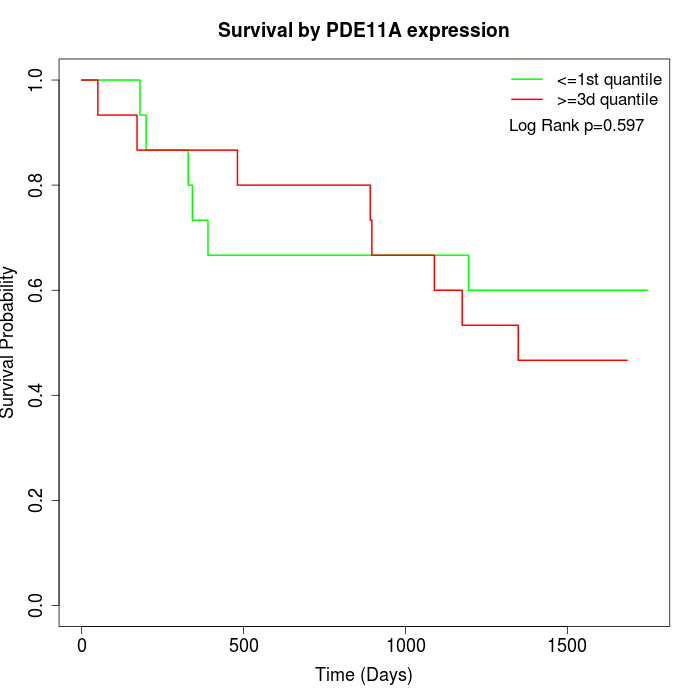 |  | 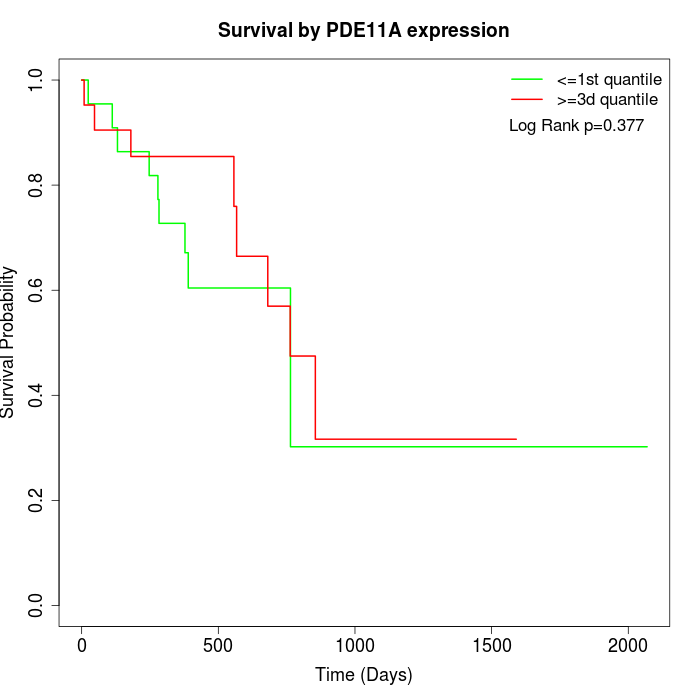 |
| GSE53622 | GSE53624 | TCGA |
Note: Click image to view full size file.
Copy number change of PDE11A:
| Dataset | Gene | EntrezID | Gain | Loss | Normal | Detail |
|---|---|---|---|---|---|---|
| GSE15526 | PDE11A | 50940 | 9 | 0 | 21 | |
| GSE20123 | PDE11A | 50940 | 9 | 0 | 21 | |
| GSE43470 | PDE11A | 50940 | 5 | 1 | 37 | |
| GSE46452 | PDE11A | 50940 | 1 | 4 | 54 | |
| GSE47630 | PDE11A | 50940 | 4 | 4 | 32 | |
| GSE54993 | PDE11A | 50940 | 0 | 5 | 65 | |
| GSE54994 | PDE11A | 50940 | 11 | 4 | 38 | |
| GSE60625 | PDE11A | 50940 | 0 | 3 | 8 | |
| GSE74703 | PDE11A | 50940 | 4 | 1 | 31 | |
| GSE74704 | PDE11A | 50940 | 5 | 0 | 15 | |
| TCGA | PDE11A | 50940 | 28 | 6 | 62 |
Total number of gains: 76; Total number of losses: 28; Total Number of normals: 384.
Somatic mutations of PDE11A:
Generating mutation plots.
Highly correlated genes for PDE11A:
Showing top 20/510 corelated genes with mean PCC>0.5.
| Gene1 | Gene2 | Mean PCC | Num. Datasets | Num. PCC<0 | Num. PCC>0.5 |
|---|---|---|---|---|---|
| PDE11A | GPD1 | 0.675548 | 3 | 0 | 3 |
| PDE11A | NTNG1 | 0.6652 | 4 | 0 | 4 |
| PDE11A | KIR3DL3 | 0.659983 | 4 | 0 | 4 |
| PDE11A | PRODH2 | 0.657541 | 5 | 0 | 5 |
| PDE11A | CYP19A1 | 0.655414 | 5 | 0 | 5 |
| PDE11A | ART4 | 0.644295 | 5 | 0 | 4 |
| PDE11A | ZMAT4 | 0.638317 | 3 | 0 | 3 |
| PDE11A | IRS4 | 0.636259 | 5 | 0 | 4 |
| PDE11A | CYSLTR2 | 0.633901 | 5 | 0 | 4 |
| PDE11A | DPF3 | 0.632279 | 7 | 0 | 6 |
| PDE11A | MYL1 | 0.630108 | 4 | 0 | 3 |
| PDE11A | KCNG1 | 0.627777 | 3 | 0 | 3 |
| PDE11A | FAM86C1 | 0.625385 | 3 | 0 | 3 |
| PDE11A | CER1 | 0.624984 | 5 | 0 | 4 |
| PDE11A | FGF16 | 0.624569 | 6 | 0 | 6 |
| PDE11A | KLC2 | 0.623101 | 4 | 0 | 4 |
| PDE11A | HRC | 0.622241 | 4 | 0 | 4 |
| PDE11A | EPOR | 0.622141 | 5 | 0 | 5 |
| PDE11A | HPX | 0.620504 | 7 | 0 | 6 |
| PDE11A | GFM1 | 0.620098 | 3 | 0 | 3 |
For details and further investigation, click here