| Full name: decaprenyl diphosphate synthase subunit 1 | Alias Symbol: TPT|COQ1|COQ1A | ||
| Type: protein-coding gene | Cytoband: 10p12.1 | ||
| Entrez ID: 23590 | HGNC ID: HGNC:17759 | Ensembl Gene: ENSG00000148459 | OMIM ID: 607429 |
Screen Evidence:
| |||
Expression of PDSS1:
| Dataset | Gene | EntrezID | Probe | Log2FC | Adj.pValue | Expression |
|---|---|---|---|---|---|---|
| GSE17351 | PDSS1 | 23590 | 220865_s_at | 0.4822 | 0.3835 | |
| GSE20347 | PDSS1 | 23590 | 220865_s_at | 0.3342 | 0.1338 | |
| GSE23400 | PDSS1 | 23590 | 220865_s_at | 0.3624 | 0.0000 | |
| GSE26886 | PDSS1 | 23590 | 220865_s_at | -0.3758 | 0.0901 | |
| GSE29001 | PDSS1 | 23590 | 220865_s_at | 0.4183 | 0.2521 | |
| GSE38129 | PDSS1 | 23590 | 220865_s_at | 0.5907 | 0.0019 | |
| GSE45670 | PDSS1 | 23590 | 220865_s_at | 0.2642 | 0.1310 | |
| GSE53622 | PDSS1 | 23590 | 84532 | 0.4315 | 0.0000 | |
| GSE53624 | PDSS1 | 23590 | 84532 | 0.4033 | 0.0000 | |
| GSE63941 | PDSS1 | 23590 | 220865_s_at | 1.2939 | 0.0297 | |
| GSE77861 | PDSS1 | 23590 | 220865_s_at | -0.1908 | 0.6352 | |
| GSE97050 | PDSS1 | 23590 | A_33_P3251796 | 0.6026 | 0.2110 | |
| SRP007169 | PDSS1 | 23590 | RNAseq | -0.1768 | 0.7245 | |
| SRP008496 | PDSS1 | 23590 | RNAseq | -0.6450 | 0.0343 | |
| SRP064894 | PDSS1 | 23590 | RNAseq | 0.0315 | 0.8745 | |
| SRP133303 | PDSS1 | 23590 | RNAseq | -0.0353 | 0.8010 | |
| SRP159526 | PDSS1 | 23590 | RNAseq | -0.0441 | 0.8805 | |
| SRP193095 | PDSS1 | 23590 | RNAseq | -0.5153 | 0.0001 | |
| SRP219564 | PDSS1 | 23590 | RNAseq | 0.0505 | 0.8987 | |
| TCGA | PDSS1 | 23590 | RNAseq | 0.3967 | 0.0000 |
Upregulated datasets: 1; Downregulated datasets: 0.
Survival by PDSS1 expression:
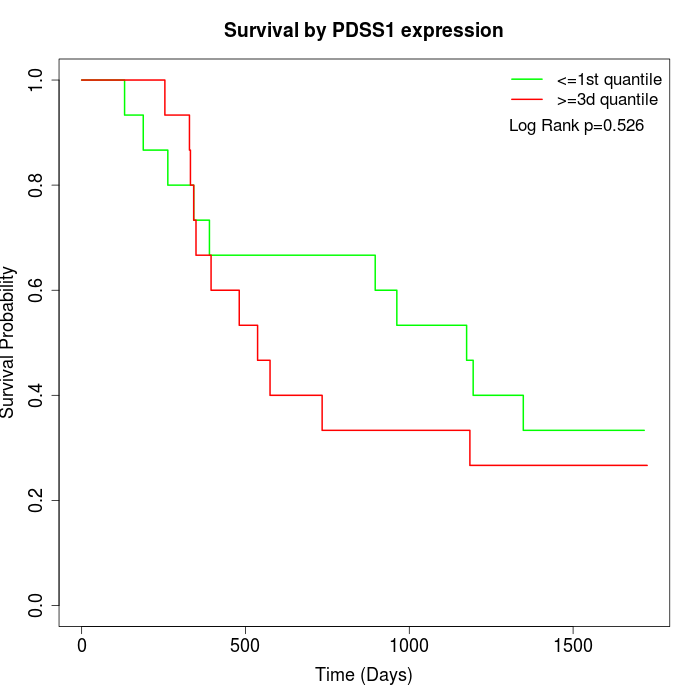 | 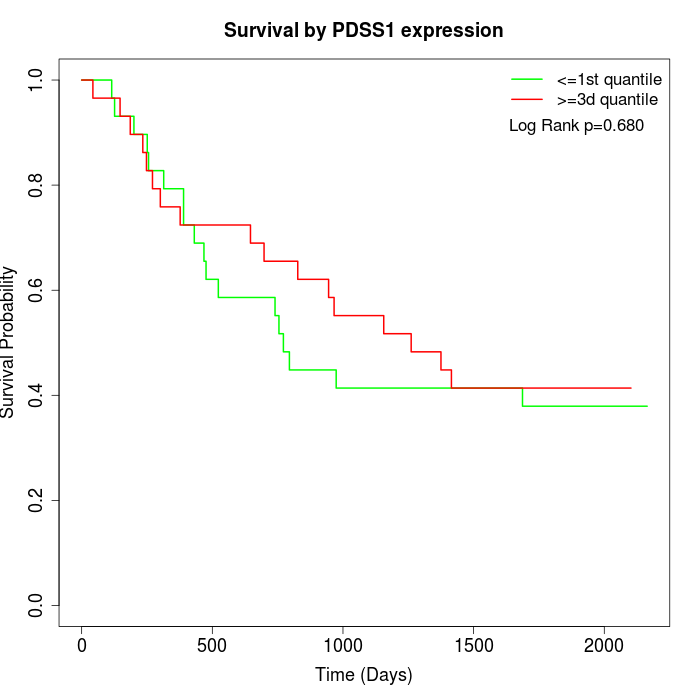 | 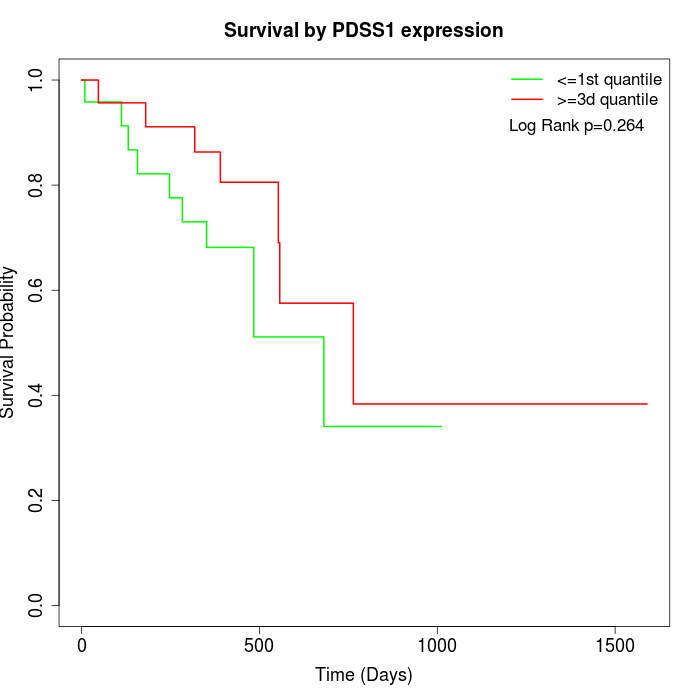 |
| GSE53622 | GSE53624 | TCGA |
Note: Click image to view full size file.
Copy number change of PDSS1:
| Dataset | Gene | EntrezID | Gain | Loss | Normal | Detail |
|---|---|---|---|---|---|---|
| GSE15526 | PDSS1 | 23590 | 4 | 7 | 19 | |
| GSE20123 | PDSS1 | 23590 | 5 | 6 | 19 | |
| GSE43470 | PDSS1 | 23590 | 3 | 4 | 36 | |
| GSE46452 | PDSS1 | 23590 | 1 | 14 | 44 | |
| GSE47630 | PDSS1 | 23590 | 5 | 15 | 20 | |
| GSE54993 | PDSS1 | 23590 | 9 | 0 | 61 | |
| GSE54994 | PDSS1 | 23590 | 3 | 9 | 41 | |
| GSE60625 | PDSS1 | 23590 | 0 | 0 | 11 | |
| GSE74703 | PDSS1 | 23590 | 2 | 2 | 32 | |
| GSE74704 | PDSS1 | 23590 | 0 | 5 | 15 | |
| TCGA | PDSS1 | 23590 | 18 | 25 | 53 |
Total number of gains: 50; Total number of losses: 87; Total Number of normals: 351.
Somatic mutations of PDSS1:
Generating mutation plots.
Highly correlated genes for PDSS1:
Showing top 20/479 corelated genes with mean PCC>0.5.
| Gene1 | Gene2 | Mean PCC | Num. Datasets | Num. PCC<0 | Num. PCC>0.5 |
|---|---|---|---|---|---|
| PDSS1 | TMEM117 | 0.669458 | 3 | 0 | 3 |
| PDSS1 | LRRC59 | 0.657198 | 7 | 0 | 7 |
| PDSS1 | EME1 | 0.652123 | 4 | 0 | 3 |
| PDSS1 | GINS4 | 0.649121 | 6 | 0 | 5 |
| PDSS1 | NUDT5 | 0.648356 | 7 | 0 | 7 |
| PDSS1 | FANCD2 | 0.640634 | 5 | 0 | 3 |
| PDSS1 | BNC1 | 0.637676 | 5 | 0 | 4 |
| PDSS1 | HSPA14 | 0.634306 | 12 | 0 | 9 |
| PDSS1 | MCM10 | 0.634083 | 9 | 0 | 8 |
| PDSS1 | SLC12A8 | 0.630348 | 5 | 0 | 4 |
| PDSS1 | CEP55 | 0.62647 | 10 | 0 | 9 |
| PDSS1 | C1QBP | 0.625937 | 9 | 0 | 7 |
| PDSS1 | NXT2 | 0.625825 | 8 | 0 | 6 |
| PDSS1 | FBXL4 | 0.625773 | 4 | 0 | 4 |
| PDSS1 | DSC3 | 0.625756 | 4 | 0 | 4 |
| PDSS1 | PRPF4 | 0.625481 | 8 | 0 | 5 |
| PDSS1 | CDC123 | 0.620382 | 12 | 0 | 9 |
| PDSS1 | FAM83B | 0.620377 | 4 | 0 | 3 |
| PDSS1 | CDC42SE1 | 0.620342 | 4 | 0 | 3 |
| PDSS1 | NUP37 | 0.617279 | 11 | 0 | 10 |
For details and further investigation, click here