| Full name: platelet endothelial aggregation receptor 1 | Alias Symbol: JEDI|FLJ00193 | ||
| Type: protein-coding gene | Cytoband: 1q23.1 | ||
| Entrez ID: 375033 | HGNC ID: HGNC:33631 | Ensembl Gene: ENSG00000187800 | OMIM ID: 610278 |
Screen Evidence:
| |||
Expression of PEAR1:
| Dataset | Gene | EntrezID | Probe | Log2FC | Adj.pValue | Expression |
|---|---|---|---|---|---|---|
| GSE17351 | PEAR1 | 375033 | 228618_at | -0.1297 | 0.8528 | |
| GSE26886 | PEAR1 | 375033 | 228618_at | 0.5549 | 0.0097 | |
| GSE45670 | PEAR1 | 375033 | 228618_at | -0.4984 | 0.1011 | |
| GSE53622 | PEAR1 | 375033 | 57287 | -0.7950 | 0.0000 | |
| GSE53624 | PEAR1 | 375033 | 57287 | -0.5118 | 0.0059 | |
| GSE63941 | PEAR1 | 375033 | 228618_at | -1.7166 | 0.0065 | |
| GSE77861 | PEAR1 | 375033 | 228618_at | 0.2669 | 0.2820 | |
| SRP007169 | PEAR1 | 375033 | RNAseq | 1.2723 | 0.0818 | |
| SRP064894 | PEAR1 | 375033 | RNAseq | 0.7569 | 0.0286 | |
| SRP133303 | PEAR1 | 375033 | RNAseq | -0.4096 | 0.1157 | |
| SRP159526 | PEAR1 | 375033 | RNAseq | -0.6940 | 0.0231 | |
| SRP193095 | PEAR1 | 375033 | RNAseq | 1.2473 | 0.0000 | |
| SRP219564 | PEAR1 | 375033 | RNAseq | -0.0631 | 0.7798 | |
| TCGA | PEAR1 | 375033 | RNAseq | -0.3745 | 0.0067 |
Upregulated datasets: 1; Downregulated datasets: 1.
Survival by PEAR1 expression:
 | 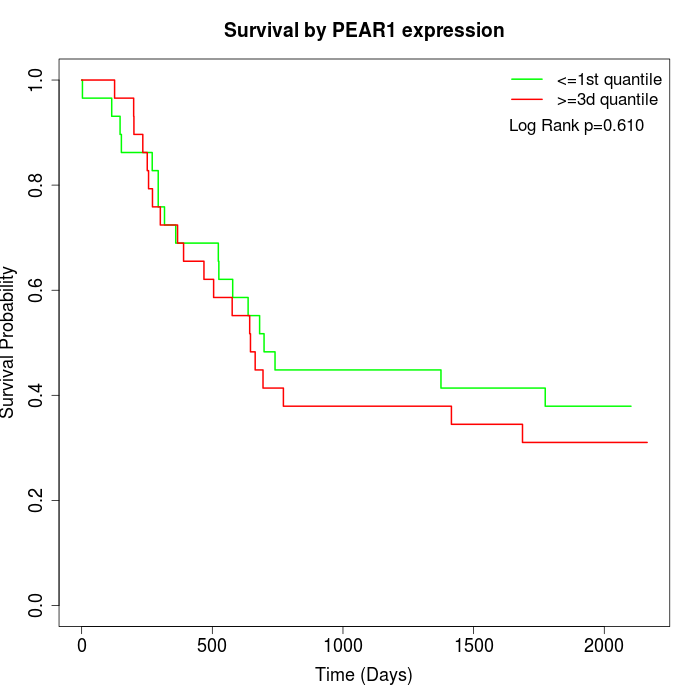 | 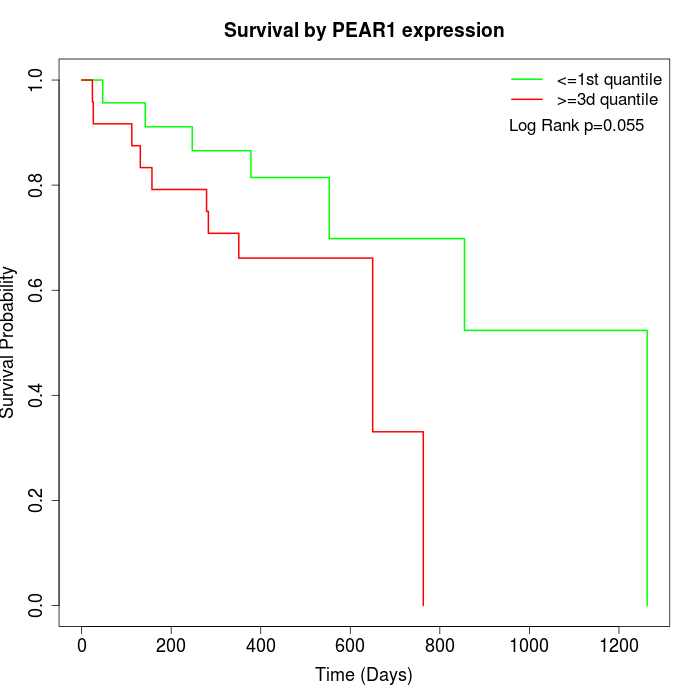 |
| GSE53622 | GSE53624 | TCGA |
Note: Click image to view full size file.
Copy number change of PEAR1:
| Dataset | Gene | EntrezID | Gain | Loss | Normal | Detail |
|---|---|---|---|---|---|---|
| GSE15526 | PEAR1 | 375033 | 11 | 0 | 19 | |
| GSE20123 | PEAR1 | 375033 | 11 | 0 | 19 | |
| GSE43470 | PEAR1 | 375033 | 7 | 2 | 34 | |
| GSE46452 | PEAR1 | 375033 | 2 | 1 | 56 | |
| GSE47630 | PEAR1 | 375033 | 14 | 0 | 26 | |
| GSE54993 | PEAR1 | 375033 | 0 | 5 | 65 | |
| GSE54994 | PEAR1 | 375033 | 16 | 0 | 37 | |
| GSE60625 | PEAR1 | 375033 | 0 | 0 | 11 | |
| GSE74703 | PEAR1 | 375033 | 7 | 2 | 27 | |
| GSE74704 | PEAR1 | 375033 | 6 | 0 | 14 | |
| TCGA | PEAR1 | 375033 | 38 | 3 | 55 |
Total number of gains: 112; Total number of losses: 13; Total Number of normals: 363.
Somatic mutations of PEAR1:
Generating mutation plots.
Highly correlated genes for PEAR1:
Showing top 20/415 corelated genes with mean PCC>0.5.
| Gene1 | Gene2 | Mean PCC | Num. Datasets | Num. PCC<0 | Num. PCC>0.5 |
|---|---|---|---|---|---|
| PEAR1 | SERPINE1 | 0.777966 | 3 | 0 | 3 |
| PEAR1 | LOXL2 | 0.768025 | 3 | 0 | 3 |
| PEAR1 | ADAMTS12 | 0.74798 | 3 | 0 | 3 |
| PEAR1 | SPRY4-IT1 | 0.742505 | 3 | 0 | 3 |
| PEAR1 | PLXND1 | 0.739253 | 4 | 0 | 4 |
| PEAR1 | AMPD2 | 0.721869 | 3 | 0 | 3 |
| PEAR1 | PHF19 | 0.707152 | 3 | 0 | 3 |
| PEAR1 | FBN1 | 0.704164 | 4 | 0 | 4 |
| PEAR1 | ANXA5 | 0.699521 | 4 | 0 | 4 |
| PEAR1 | MXRA8 | 0.697481 | 4 | 0 | 4 |
| PEAR1 | KLF10 | 0.697105 | 3 | 0 | 3 |
| PEAR1 | RBP1 | 0.694444 | 3 | 0 | 3 |
| PEAR1 | MRC2 | 0.692101 | 3 | 0 | 3 |
| PEAR1 | RAB23 | 0.692025 | 3 | 0 | 3 |
| PEAR1 | BGN | 0.690511 | 4 | 0 | 4 |
| PEAR1 | WFS1 | 0.688997 | 3 | 0 | 3 |
| PEAR1 | TENM2 | 0.685429 | 3 | 0 | 3 |
| PEAR1 | RASL11B | 0.684104 | 3 | 0 | 3 |
| PEAR1 | ISLR | 0.68338 | 4 | 0 | 4 |
| PEAR1 | FILIP1 | 0.681973 | 3 | 0 | 3 |
For details and further investigation, click here