| Full name: phosphatidylinositol glycan anchor biosynthesis class H | Alias Symbol: GPI-H | ||
| Type: protein-coding gene | Cytoband: 14q24.1 | ||
| Entrez ID: 5283 | HGNC ID: HGNC:8964 | Ensembl Gene: ENSG00000100564 | OMIM ID: 600154 |
Screen Evidence:
| |||
Expression of PIGH:
| Dataset | Gene | EntrezID | Probe | Log2FC | Adj.pValue | Expression |
|---|---|---|---|---|---|---|
| GSE17351 | PIGH | 5283 | 209625_at | 0.0268 | 0.9539 | |
| GSE20347 | PIGH | 5283 | 209625_at | 0.2084 | 0.2844 | |
| GSE23400 | PIGH | 5283 | 209625_at | 0.2182 | 0.0000 | |
| GSE26886 | PIGH | 5283 | 209625_at | 0.6254 | 0.0004 | |
| GSE29001 | PIGH | 5283 | 209625_at | 0.1533 | 0.3249 | |
| GSE38129 | PIGH | 5283 | 209625_at | 0.2483 | 0.0354 | |
| GSE45670 | PIGH | 5283 | 209625_at | 0.1682 | 0.3790 | |
| GSE53622 | PIGH | 5283 | 46801 | 0.3354 | 0.0028 | |
| GSE53624 | PIGH | 5283 | 46801 | 0.2904 | 0.0134 | |
| GSE63941 | PIGH | 5283 | 209625_at | 0.9051 | 0.0994 | |
| GSE77861 | PIGH | 5283 | 209625_at | 0.0033 | 0.9908 | |
| GSE97050 | PIGH | 5283 | A_23_P2884 | 0.1700 | 0.5817 | |
| SRP007169 | PIGH | 5283 | RNAseq | 0.0943 | 0.7956 | |
| SRP008496 | PIGH | 5283 | RNAseq | 0.1468 | 0.5635 | |
| SRP064894 | PIGH | 5283 | RNAseq | -0.0256 | 0.8883 | |
| SRP133303 | PIGH | 5283 | RNAseq | 0.2349 | 0.0224 | |
| SRP159526 | PIGH | 5283 | RNAseq | 0.1127 | 0.7110 | |
| SRP193095 | PIGH | 5283 | RNAseq | -0.0809 | 0.5669 | |
| SRP219564 | PIGH | 5283 | RNAseq | 0.5511 | 0.2312 | |
| TCGA | PIGH | 5283 | RNAseq | -0.1467 | 0.0165 |
Upregulated datasets: 0; Downregulated datasets: 0.
Survival by PIGH expression:
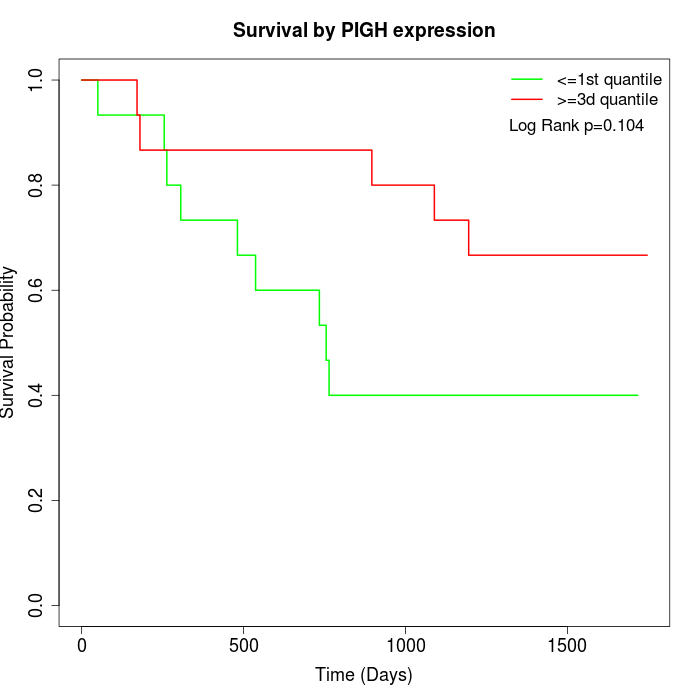 | 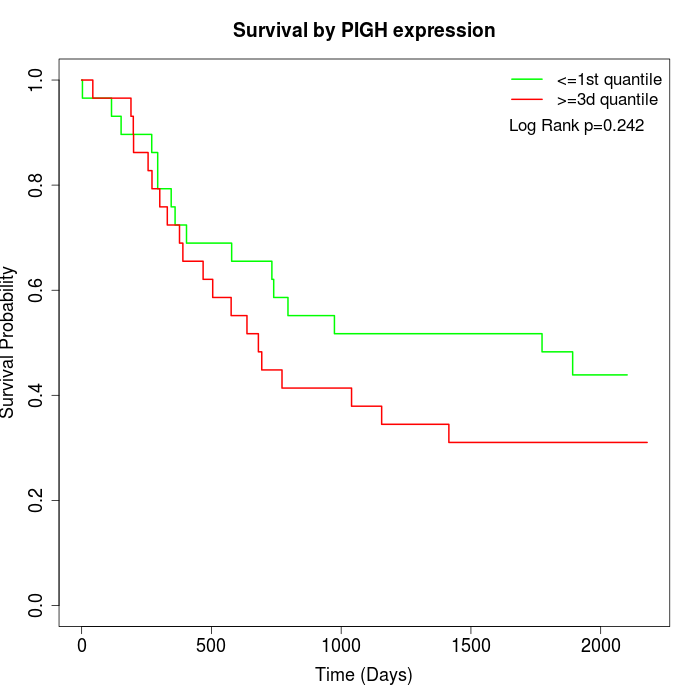 | 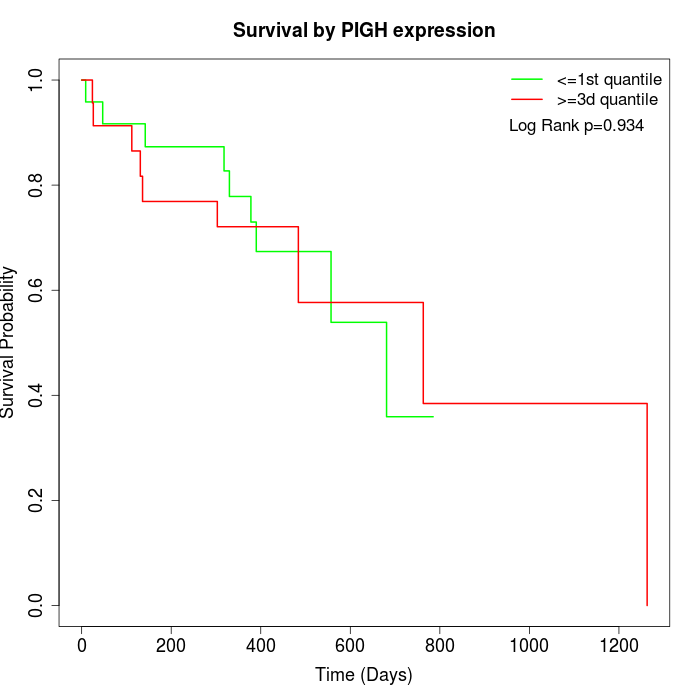 |
| GSE53622 | GSE53624 | TCGA |
Note: Click image to view full size file.
Copy number change of PIGH:
| Dataset | Gene | EntrezID | Gain | Loss | Normal | Detail |
|---|---|---|---|---|---|---|
| GSE15526 | PIGH | 5283 | 7 | 2 | 21 | |
| GSE20123 | PIGH | 5283 | 7 | 2 | 21 | |
| GSE43470 | PIGH | 5283 | 8 | 2 | 33 | |
| GSE46452 | PIGH | 5283 | 16 | 3 | 40 | |
| GSE47630 | PIGH | 5283 | 11 | 9 | 20 | |
| GSE54993 | PIGH | 5283 | 3 | 9 | 58 | |
| GSE54994 | PIGH | 5283 | 18 | 5 | 30 | |
| GSE60625 | PIGH | 5283 | 0 | 2 | 9 | |
| GSE74703 | PIGH | 5283 | 7 | 2 | 27 | |
| GSE74704 | PIGH | 5283 | 3 | 2 | 15 | |
| TCGA | PIGH | 5283 | 33 | 14 | 49 |
Total number of gains: 113; Total number of losses: 52; Total Number of normals: 323.
Somatic mutations of PIGH:
Generating mutation plots.
Highly correlated genes for PIGH:
Showing top 20/800 corelated genes with mean PCC>0.5.
| Gene1 | Gene2 | Mean PCC | Num. Datasets | Num. PCC<0 | Num. PCC>0.5 |
|---|---|---|---|---|---|
| PIGH | C1orf50 | 0.759432 | 5 | 0 | 5 |
| PIGH | KTI12 | 0.757327 | 3 | 0 | 3 |
| PIGH | MARK1 | 0.753973 | 3 | 0 | 3 |
| PIGH | DMAP1 | 0.751355 | 3 | 0 | 3 |
| PIGH | PDE7A | 0.74592 | 3 | 0 | 3 |
| PIGH | CSTF3 | 0.726808 | 3 | 0 | 3 |
| PIGH | MEX3B | 0.713371 | 3 | 0 | 3 |
| PIGH | DSEL | 0.709195 | 3 | 0 | 3 |
| PIGH | PITRM1 | 0.707729 | 3 | 0 | 3 |
| PIGH | MTMR6 | 0.707694 | 3 | 0 | 3 |
| PIGH | MRPL36 | 0.705734 | 3 | 0 | 3 |
| PIGH | SDHAF2 | 0.704931 | 4 | 0 | 4 |
| PIGH | IFT46 | 0.70285 | 3 | 0 | 3 |
| PIGH | JKAMP | 0.701027 | 7 | 0 | 6 |
| PIGH | ATRIP | 0.699419 | 3 | 0 | 3 |
| PIGH | CELF1 | 0.697737 | 3 | 0 | 3 |
| PIGH | UBE2N | 0.697595 | 3 | 0 | 3 |
| PIGH | LRRCC1 | 0.697413 | 3 | 0 | 3 |
| PIGH | PIAS4 | 0.694425 | 4 | 0 | 4 |
| PIGH | CEP128 | 0.693892 | 3 | 0 | 3 |
For details and further investigation, click here