| Full name: cleavage stimulation factor subunit 3 | Alias Symbol: CstF-77 | ||
| Type: protein-coding gene | Cytoband: 11p13 | ||
| Entrez ID: 1479 | HGNC ID: HGNC:2485 | Ensembl Gene: ENSG00000176102 | OMIM ID: 600367 |
Screen Evidence:
| |||
Expression of CSTF3:
| Dataset | Gene | EntrezID | Probe | Log2FC | Adj.pValue | Expression |
|---|---|---|---|---|---|---|
| GSE17351 | CSTF3 | 1479 | 203947_at | 0.5997 | 0.1219 | |
| GSE20347 | CSTF3 | 1479 | 203947_at | 0.4536 | 0.0002 | |
| GSE23400 | CSTF3 | 1479 | 203947_at | 0.3951 | 0.0000 | |
| GSE26886 | CSTF3 | 1479 | 203947_at | 0.5266 | 0.0039 | |
| GSE29001 | CSTF3 | 1479 | 203947_at | 0.4803 | 0.0325 | |
| GSE38129 | CSTF3 | 1479 | 203947_at | 0.5939 | 0.0000 | |
| GSE45670 | CSTF3 | 1479 | 203947_at | 0.2828 | 0.0149 | |
| GSE53622 | CSTF3 | 1479 | 34775 | 0.3743 | 0.0000 | |
| GSE53624 | CSTF3 | 1479 | 34775 | 0.3412 | 0.0000 | |
| GSE63941 | CSTF3 | 1479 | 203947_at | 0.4614 | 0.2914 | |
| GSE77861 | CSTF3 | 1479 | 203947_at | 0.5623 | 0.0447 | |
| GSE97050 | CSTF3 | 1479 | A_24_P256552 | 0.3824 | 0.2733 | |
| SRP007169 | CSTF3 | 1479 | RNAseq | 1.0091 | 0.0335 | |
| SRP008496 | CSTF3 | 1479 | RNAseq | 0.8097 | 0.0464 | |
| SRP064894 | CSTF3 | 1479 | RNAseq | 0.0309 | 0.8010 | |
| SRP133303 | CSTF3 | 1479 | RNAseq | 0.3287 | 0.0805 | |
| SRP159526 | CSTF3 | 1479 | RNAseq | 0.0954 | 0.7043 | |
| SRP193095 | CSTF3 | 1479 | RNAseq | 0.1491 | 0.1126 | |
| SRP219564 | CSTF3 | 1479 | RNAseq | 0.2250 | 0.4996 | |
| TCGA | CSTF3 | 1479 | RNAseq | 0.2310 | 0.0000 |
Upregulated datasets: 1; Downregulated datasets: 0.
Survival by CSTF3 expression:
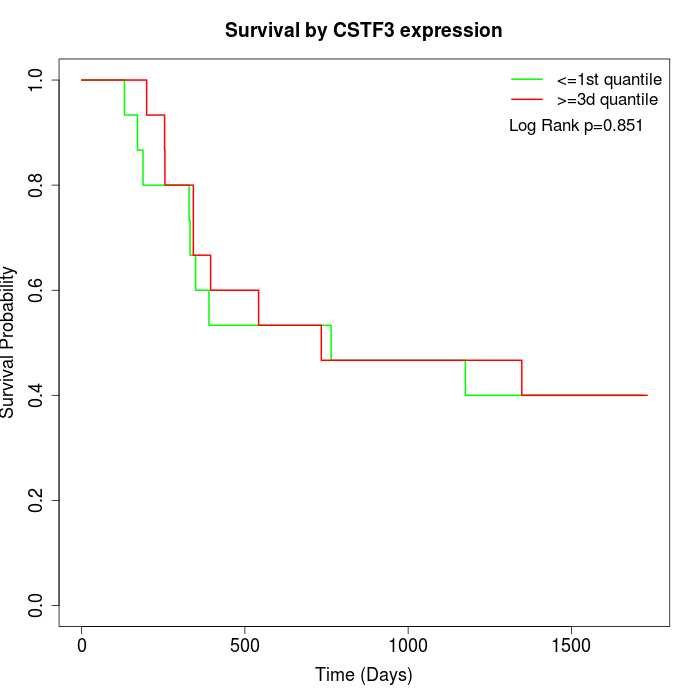 | 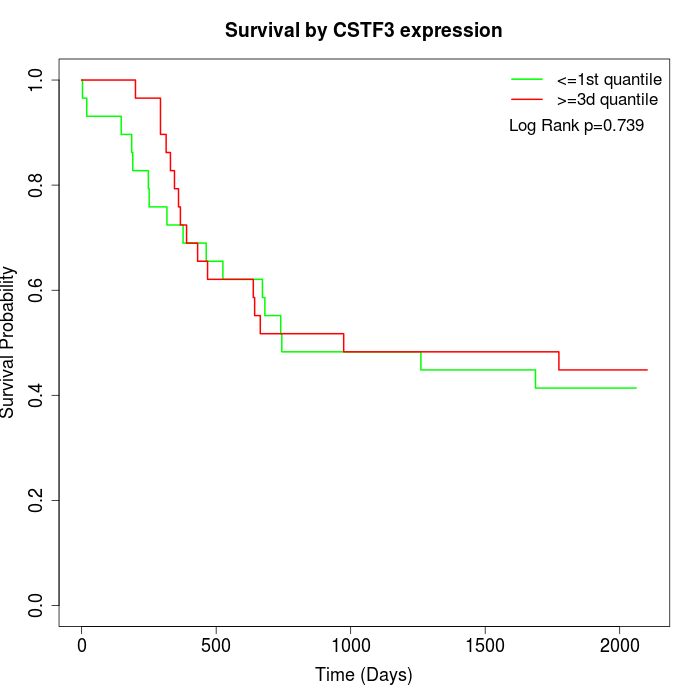 |  |
| GSE53622 | GSE53624 | TCGA |
Note: Click image to view full size file.
Copy number change of CSTF3:
| Dataset | Gene | EntrezID | Gain | Loss | Normal | Detail |
|---|---|---|---|---|---|---|
| GSE15526 | CSTF3 | 1479 | 0 | 7 | 23 | |
| GSE20123 | CSTF3 | 1479 | 0 | 6 | 24 | |
| GSE43470 | CSTF3 | 1479 | 2 | 4 | 37 | |
| GSE46452 | CSTF3 | 1479 | 8 | 5 | 46 | |
| GSE47630 | CSTF3 | 1479 | 3 | 10 | 27 | |
| GSE54993 | CSTF3 | 1479 | 3 | 0 | 67 | |
| GSE54994 | CSTF3 | 1479 | 3 | 10 | 40 | |
| GSE60625 | CSTF3 | 1479 | 0 | 0 | 11 | |
| GSE74703 | CSTF3 | 1479 | 2 | 2 | 32 | |
| GSE74704 | CSTF3 | 1479 | 0 | 4 | 16 | |
| TCGA | CSTF3 | 1479 | 13 | 25 | 58 |
Total number of gains: 34; Total number of losses: 73; Total Number of normals: 381.
Somatic mutations of CSTF3:
Generating mutation plots.
Highly correlated genes for CSTF3:
Showing top 20/1469 corelated genes with mean PCC>0.5.
| Gene1 | Gene2 | Mean PCC | Num. Datasets | Num. PCC<0 | Num. PCC>0.5 |
|---|---|---|---|---|---|
| CSTF3 | ALG2 | 0.782832 | 4 | 0 | 4 |
| CSTF3 | PIGH | 0.726808 | 3 | 0 | 3 |
| CSTF3 | POLB | 0.721713 | 3 | 0 | 3 |
| CSTF3 | LRRC69 | 0.719238 | 3 | 0 | 3 |
| CSTF3 | FBXO5 | 0.716159 | 7 | 0 | 7 |
| CSTF3 | COX11 | 0.711094 | 4 | 0 | 4 |
| CSTF3 | SLC44A1 | 0.706358 | 5 | 0 | 4 |
| CSTF3 | XPNPEP3 | 0.701962 | 4 | 0 | 3 |
| CSTF3 | SOCS4 | 0.701175 | 4 | 0 | 4 |
| CSTF3 | TOP2A | 0.698858 | 9 | 0 | 9 |
| CSTF3 | PDE8A | 0.697511 | 3 | 0 | 3 |
| CSTF3 | NRIP1 | 0.694088 | 3 | 0 | 3 |
| CSTF3 | CPSF3 | 0.693752 | 5 | 0 | 5 |
| CSTF3 | RMI1 | 0.690252 | 9 | 0 | 9 |
| CSTF3 | UBR7 | 0.688522 | 4 | 0 | 4 |
| CSTF3 | TLCD1 | 0.687806 | 3 | 0 | 3 |
| CSTF3 | PRKDC | 0.686209 | 10 | 0 | 10 |
| CSTF3 | SMC2 | 0.685667 | 9 | 0 | 8 |
| CSTF3 | LSM10 | 0.685098 | 3 | 0 | 3 |
| CSTF3 | ISG20L2 | 0.68406 | 8 | 0 | 8 |
For details and further investigation, click here