| Full name: Pim-3 proto-oncogene, serine/threonine kinase | Alias Symbol: | ||
| Type: protein-coding gene | Cytoband: 22q13.33 | ||
| Entrez ID: 415116 | HGNC ID: HGNC:19310 | Ensembl Gene: ENSG00000198355 | OMIM ID: 610580 |
| Related drugs: AZD-1208, LGH-447, SGI-1776, VADIMEZAN... [more] | |||
Expression of PIM3:
| Dataset | Gene | EntrezID | Probe | Log2FC | Adj.pValue | Expression |
|---|---|---|---|---|---|---|
| GSE17351 | PIM3 | 415116 | 224739_at | 0.2781 | 0.4775 | |
| GSE26886 | PIM3 | 415116 | 224739_at | 0.7202 | 0.0009 | |
| GSE45670 | PIM3 | 415116 | 224739_at | 0.4047 | 0.0081 | |
| GSE53622 | PIM3 | 415116 | 5088 | 0.0169 | 0.8661 | |
| GSE53624 | PIM3 | 415116 | 5088 | 0.0438 | 0.5127 | |
| GSE63941 | PIM3 | 415116 | 224739_at | 0.9005 | 0.0879 | |
| GSE77861 | PIM3 | 415116 | 224739_at | 0.5633 | 0.0111 | |
| GSE97050 | PIM3 | 415116 | A_23_P61398 | 0.4482 | 0.1832 | |
| SRP007169 | PIM3 | 415116 | RNAseq | -1.3744 | 0.0000 | |
| SRP008496 | PIM3 | 415116 | RNAseq | -1.2843 | 0.0000 | |
| SRP064894 | PIM3 | 415116 | RNAseq | 0.1202 | 0.5962 | |
| SRP133303 | PIM3 | 415116 | RNAseq | 0.1746 | 0.3564 | |
| SRP159526 | PIM3 | 415116 | RNAseq | 0.4783 | 0.1898 | |
| SRP193095 | PIM3 | 415116 | RNAseq | 0.2593 | 0.1291 | |
| SRP219564 | PIM3 | 415116 | RNAseq | 0.5237 | 0.0268 | |
| TCGA | PIM3 | 415116 | RNAseq | -0.1626 | 0.0032 |
Upregulated datasets: 0; Downregulated datasets: 2.
Survival by PIM3 expression:
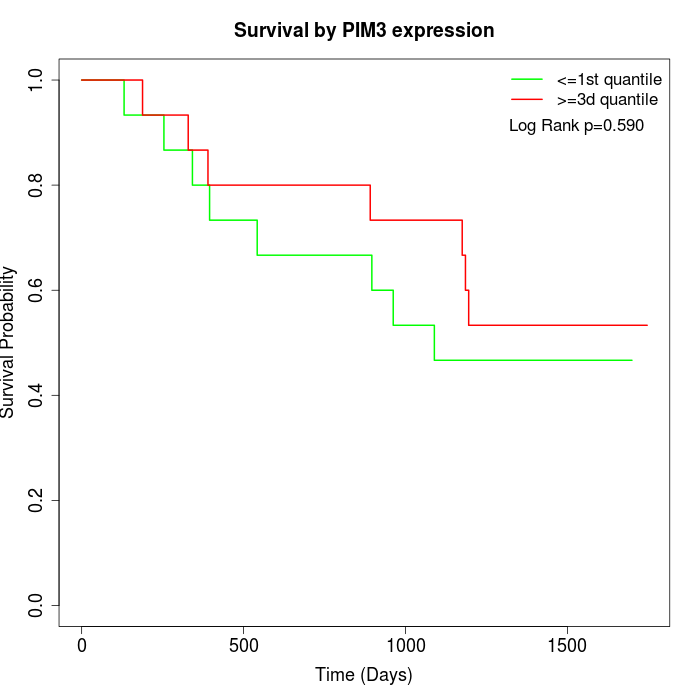 | 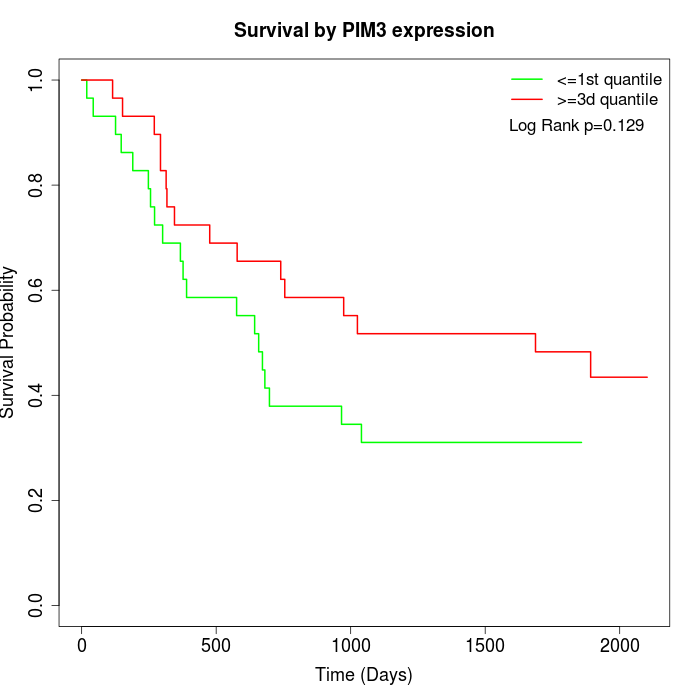 | 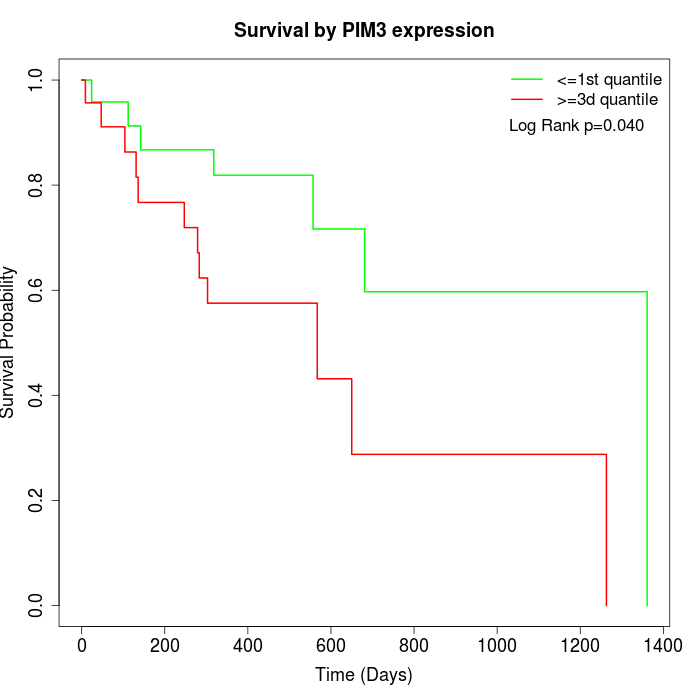 |
| GSE53622 | GSE53624 | TCGA |
Note: Click image to view full size file.
Copy number change of PIM3:
| Dataset | Gene | EntrezID | Gain | Loss | Normal | Detail |
|---|---|---|---|---|---|---|
| GSE15526 | PIM3 | 415116 | 3 | 8 | 19 | |
| GSE20123 | PIM3 | 415116 | 3 | 8 | 19 | |
| GSE43470 | PIM3 | 415116 | 2 | 8 | 33 | |
| GSE46452 | PIM3 | 415116 | 31 | 2 | 26 | |
| GSE47630 | PIM3 | 415116 | 9 | 4 | 27 | |
| GSE54993 | PIM3 | 415116 | 4 | 6 | 60 | |
| GSE54994 | PIM3 | 415116 | 11 | 8 | 34 | |
| GSE60625 | PIM3 | 415116 | 5 | 0 | 6 | |
| GSE74703 | PIM3 | 415116 | 2 | 6 | 28 | |
| GSE74704 | PIM3 | 415116 | 1 | 4 | 15 | |
| TCGA | PIM3 | 415116 | 26 | 16 | 54 |
Total number of gains: 97; Total number of losses: 70; Total Number of normals: 321.
Somatic mutations of PIM3:
Generating mutation plots.
Highly correlated genes for PIM3:
Showing top 20/206 corelated genes with mean PCC>0.5.
| Gene1 | Gene2 | Mean PCC | Num. Datasets | Num. PCC<0 | Num. PCC>0.5 |
|---|---|---|---|---|---|
| PIM3 | MYBBP1A | 0.750359 | 3 | 0 | 3 |
| PIM3 | MDK | 0.701077 | 3 | 0 | 3 |
| PIM3 | SNAPC2 | 0.693104 | 3 | 0 | 3 |
| PIM3 | ARID5A | 0.686884 | 3 | 0 | 3 |
| PIM3 | MORC2 | 0.6765 | 3 | 0 | 3 |
| PIM3 | PHF5A | 0.671794 | 4 | 0 | 4 |
| PIM3 | SRRT | 0.664851 | 3 | 0 | 3 |
| PIM3 | DUSP2 | 0.661544 | 4 | 0 | 4 |
| PIM3 | TOMM40 | 0.655352 | 3 | 0 | 3 |
| PIM3 | CMC2 | 0.647566 | 4 | 0 | 4 |
| PIM3 | BCAR1 | 0.645446 | 5 | 0 | 5 |
| PIM3 | LSG1 | 0.642473 | 3 | 0 | 3 |
| PIM3 | PFDN2 | 0.642081 | 4 | 0 | 4 |
| PIM3 | TMEM184B | 0.639939 | 4 | 0 | 3 |
| PIM3 | TRIB2 | 0.634858 | 3 | 0 | 3 |
| PIM3 | GTSE1 | 0.633318 | 4 | 0 | 4 |
| PIM3 | LSM4 | 0.632708 | 3 | 0 | 3 |
| PIM3 | ACD | 0.630855 | 3 | 0 | 3 |
| PIM3 | MCM4 | 0.629882 | 4 | 0 | 3 |
| PIM3 | EDC4 | 0.629648 | 4 | 0 | 4 |
For details and further investigation, click here