| Full name: phosphatidylinositol transfer protein membrane associated 1 | Alias Symbol: DRES9|NIR2|RDGB1|RDGBA1|Rd9|RDGB | ||
| Type: protein-coding gene | Cytoband: 11q13.2 | ||
| Entrez ID: 9600 | HGNC ID: HGNC:9003 | Ensembl Gene: ENSG00000110697 | OMIM ID: 608794 |
Screen Evidence:
| |||
Expression of PITPNM1:
| Dataset | Gene | EntrezID | Probe | Log2FC | Adj.pValue | Expression |
|---|---|---|---|---|---|---|
| GSE17351 | PITPNM1 | 9600 | 203826_s_at | 0.4615 | 0.1831 | |
| GSE20347 | PITPNM1 | 9600 | 203826_s_at | 0.1560 | 0.3094 | |
| GSE23400 | PITPNM1 | 9600 | 203826_s_at | -0.1170 | 0.0837 | |
| GSE26886 | PITPNM1 | 9600 | 203826_s_at | -0.0096 | 0.9669 | |
| GSE29001 | PITPNM1 | 9600 | 203826_s_at | -0.3275 | 0.1088 | |
| GSE38129 | PITPNM1 | 9600 | 203826_s_at | 0.1488 | 0.2435 | |
| GSE45670 | PITPNM1 | 9600 | 203826_s_at | 0.2227 | 0.0400 | |
| GSE53622 | PITPNM1 | 9600 | 124144 | 0.1711 | 0.0994 | |
| GSE53624 | PITPNM1 | 9600 | 124144 | 0.1316 | 0.0749 | |
| GSE63941 | PITPNM1 | 9600 | 203826_s_at | 0.9951 | 0.0551 | |
| GSE77861 | PITPNM1 | 9600 | 203826_s_at | 0.1600 | 0.5008 | |
| GSE97050 | PITPNM1 | 9600 | A_23_P1519 | 0.5026 | 0.1745 | |
| SRP007169 | PITPNM1 | 9600 | RNAseq | -1.5578 | 0.0003 | |
| SRP008496 | PITPNM1 | 9600 | RNAseq | -1.5678 | 0.0000 | |
| SRP064894 | PITPNM1 | 9600 | RNAseq | -0.4241 | 0.0396 | |
| SRP133303 | PITPNM1 | 9600 | RNAseq | 0.2021 | 0.4765 | |
| SRP159526 | PITPNM1 | 9600 | RNAseq | -0.6273 | 0.0129 | |
| SRP193095 | PITPNM1 | 9600 | RNAseq | 0.1672 | 0.2563 | |
| SRP219564 | PITPNM1 | 9600 | RNAseq | -0.3764 | 0.3988 | |
| TCGA | PITPNM1 | 9600 | RNAseq | 0.1003 | 0.1237 |
Upregulated datasets: 0; Downregulated datasets: 2.
Survival by PITPNM1 expression:
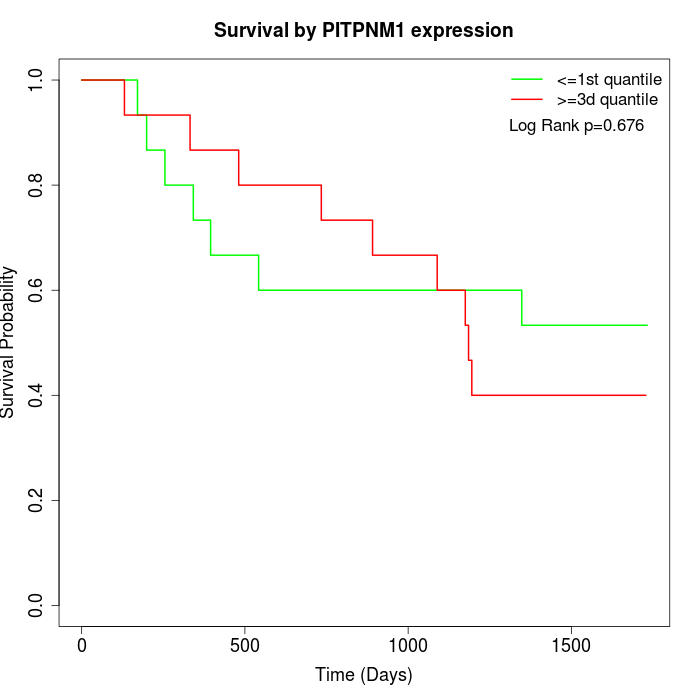 | 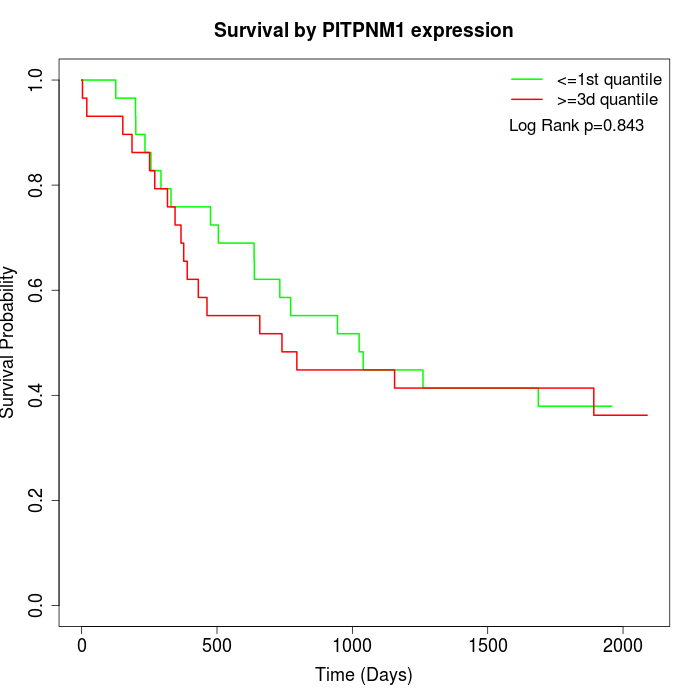 |  |
| GSE53622 | GSE53624 | TCGA |
Note: Click image to view full size file.
Copy number change of PITPNM1:
| Dataset | Gene | EntrezID | Gain | Loss | Normal | Detail |
|---|---|---|---|---|---|---|
| GSE15526 | PITPNM1 | 9600 | 10 | 3 | 17 | |
| GSE20123 | PITPNM1 | 9600 | 10 | 3 | 17 | |
| GSE43470 | PITPNM1 | 9600 | 5 | 2 | 36 | |
| GSE46452 | PITPNM1 | 9600 | 14 | 3 | 42 | |
| GSE47630 | PITPNM1 | 9600 | 8 | 5 | 27 | |
| GSE54993 | PITPNM1 | 9600 | 3 | 1 | 66 | |
| GSE54994 | PITPNM1 | 9600 | 13 | 4 | 36 | |
| GSE60625 | PITPNM1 | 9600 | 0 | 3 | 8 | |
| GSE74703 | PITPNM1 | 9600 | 4 | 1 | 31 | |
| GSE74704 | PITPNM1 | 9600 | 8 | 1 | 11 | |
| TCGA | PITPNM1 | 9600 | 30 | 8 | 58 |
Total number of gains: 105; Total number of losses: 34; Total Number of normals: 349.
Somatic mutations of PITPNM1:
Generating mutation plots.
Highly correlated genes for PITPNM1:
Showing top 20/166 corelated genes with mean PCC>0.5.
| Gene1 | Gene2 | Mean PCC | Num. Datasets | Num. PCC<0 | Num. PCC>0.5 |
|---|---|---|---|---|---|
| PITPNM1 | HYAL2 | 0.658659 | 3 | 0 | 3 |
| PITPNM1 | C4orf48 | 0.638311 | 3 | 0 | 3 |
| PITPNM1 | HOXD-AS2 | 0.625271 | 3 | 0 | 3 |
| PITPNM1 | IGSF8 | 0.621315 | 3 | 0 | 3 |
| PITPNM1 | RHOF | 0.618182 | 4 | 0 | 3 |
| PITPNM1 | CHPF2 | 0.617373 | 5 | 0 | 3 |
| PITPNM1 | UBXN11 | 0.613181 | 3 | 0 | 3 |
| PITPNM1 | OTX1 | 0.612274 | 3 | 0 | 3 |
| PITPNM1 | KCNQ1 | 0.612264 | 4 | 0 | 3 |
| PITPNM1 | CDK2AP2 | 0.611546 | 10 | 0 | 8 |
| PITPNM1 | S100A7A | 0.605327 | 3 | 0 | 3 |
| PITPNM1 | CCDC70 | 0.604688 | 3 | 0 | 3 |
| PITPNM1 | PTK2B | 0.602272 | 3 | 0 | 3 |
| PITPNM1 | UBR4 | 0.597277 | 3 | 0 | 3 |
| PITPNM1 | PLCB3 | 0.594633 | 9 | 0 | 6 |
| PITPNM1 | IFRD2 | 0.594139 | 3 | 0 | 3 |
| PITPNM1 | SIPA1L3 | 0.587718 | 4 | 0 | 3 |
| PITPNM1 | SH2D2A | 0.587391 | 4 | 0 | 3 |
| PITPNM1 | SPHK1 | 0.585744 | 5 | 0 | 4 |
| PITPNM1 | COL1A1 | 0.584575 | 3 | 0 | 3 |
For details and further investigation, click here