| Full name: plasminogen activator, tissue type | Alias Symbol: | ||
| Type: protein-coding gene | Cytoband: 8p11.21 | ||
| Entrez ID: 5327 | HGNC ID: HGNC:9051 | Ensembl Gene: ENSG00000104368 | OMIM ID: 173370 |
| Related drugs: AMINOCAPROIC ACID, ATORVASTATIN, CHEMBL290376, EPOETIN BETA, MELPHALAN, NAPROXEN, RALOXIFENE, TRANEXAMIC ACID, UROKINASE... [more] | |||
PLAT involved pathways:
| KEGG pathway | Description | View |
|---|---|---|
| hsa04610 | Complement and coagulation cascades |
Expression of PLAT:
| Dataset | Gene | EntrezID | Probe | Log2FC | Adj.pValue | Expression |
|---|---|---|---|---|---|---|
| GSE17351 | PLAT | 5327 | 201860_s_at | 1.1211 | 0.3247 | |
| GSE20347 | PLAT | 5327 | 201860_s_at | 1.3568 | 0.0178 | |
| GSE23400 | PLAT | 5327 | 201860_s_at | 0.8811 | 0.0001 | |
| GSE26886 | PLAT | 5327 | 201860_s_at | 1.0973 | 0.2193 | |
| GSE29001 | PLAT | 5327 | 201860_s_at | 1.0679 | 0.0298 | |
| GSE38129 | PLAT | 5327 | 201860_s_at | 0.8821 | 0.0413 | |
| GSE45670 | PLAT | 5327 | 201860_s_at | 1.6682 | 0.0013 | |
| GSE53622 | PLAT | 5327 | 9715 | 0.9779 | 0.0000 | |
| GSE53624 | PLAT | 5327 | 20641 | 1.0591 | 0.0000 | |
| GSE63941 | PLAT | 5327 | 201860_s_at | -5.0127 | 0.0108 | |
| GSE77861 | PLAT | 5327 | 201860_s_at | 1.8490 | 0.0665 | |
| GSE97050 | PLAT | 5327 | A_23_P82868 | 1.4646 | 0.1198 | |
| SRP007169 | PLAT | 5327 | RNAseq | 3.6567 | 0.0000 | |
| SRP008496 | PLAT | 5327 | RNAseq | 1.7548 | 0.0275 | |
| SRP064894 | PLAT | 5327 | RNAseq | 1.6400 | 0.0001 | |
| SRP133303 | PLAT | 5327 | RNAseq | 1.1271 | 0.0017 | |
| SRP159526 | PLAT | 5327 | RNAseq | 0.9438 | 0.0038 | |
| SRP193095 | PLAT | 5327 | RNAseq | 1.6687 | 0.0000 | |
| SRP219564 | PLAT | 5327 | RNAseq | 0.4998 | 0.3606 | |
| TCGA | PLAT | 5327 | RNAseq | 0.1127 | 0.3399 |
Upregulated datasets: 9; Downregulated datasets: 1.
Survival by PLAT expression:
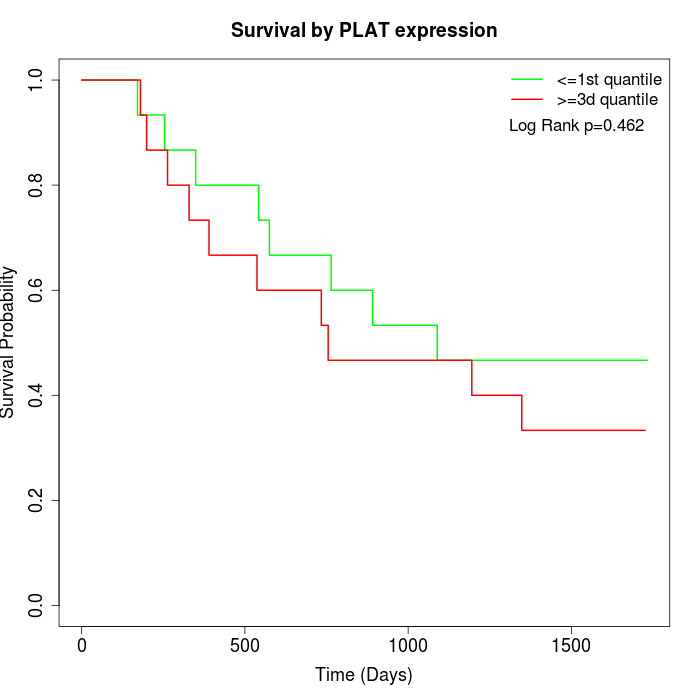 | 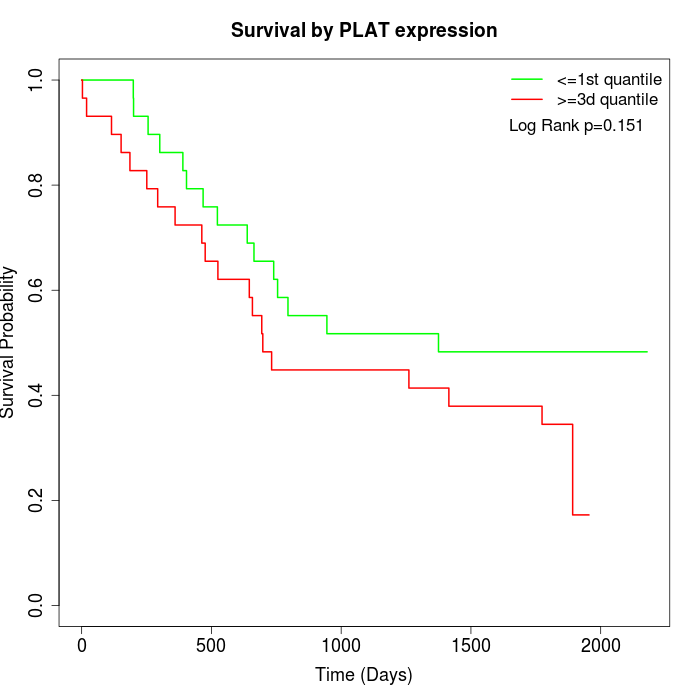 | 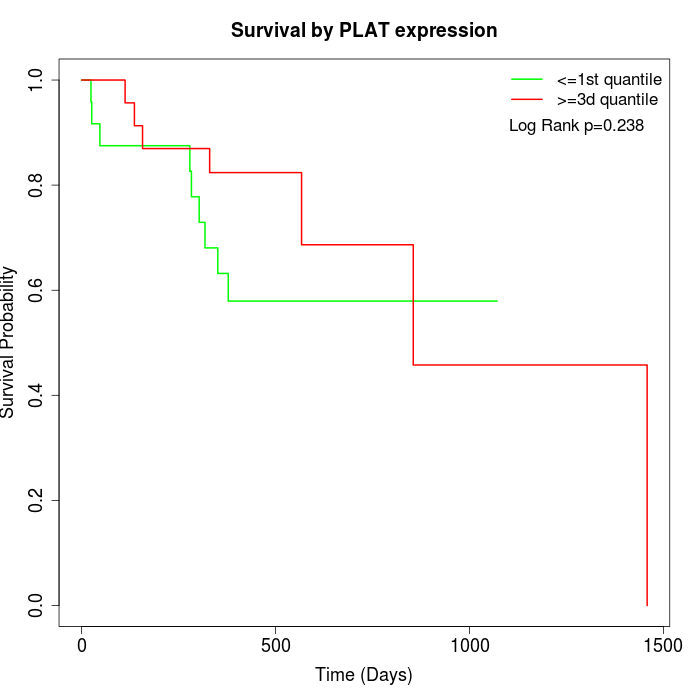 |
| GSE53622 | GSE53624 | TCGA |
Note: Click image to view full size file.
Copy number change of PLAT:
| Dataset | Gene | EntrezID | Gain | Loss | Normal | Detail |
|---|---|---|---|---|---|---|
| GSE15526 | PLAT | 5327 | 10 | 5 | 15 | |
| GSE20123 | PLAT | 5327 | 10 | 5 | 15 | |
| GSE43470 | PLAT | 5327 | 9 | 6 | 28 | |
| GSE46452 | PLAT | 5327 | 19 | 5 | 35 | |
| GSE47630 | PLAT | 5327 | 22 | 1 | 17 | |
| GSE54993 | PLAT | 5327 | 1 | 16 | 53 | |
| GSE54994 | PLAT | 5327 | 19 | 7 | 27 | |
| GSE60625 | PLAT | 5327 | 3 | 0 | 8 | |
| GSE74703 | PLAT | 5327 | 8 | 5 | 23 | |
| GSE74704 | PLAT | 5327 | 9 | 2 | 9 | |
| TCGA | PLAT | 5327 | 40 | 22 | 34 |
Total number of gains: 150; Total number of losses: 74; Total Number of normals: 264.
Somatic mutations of PLAT:
Generating mutation plots.
Highly correlated genes for PLAT:
Showing top 20/474 corelated genes with mean PCC>0.5.
| Gene1 | Gene2 | Mean PCC | Num. Datasets | Num. PCC<0 | Num. PCC>0.5 |
|---|---|---|---|---|---|
| PLAT | OSBPL6 | 0.756315 | 3 | 0 | 3 |
| PLAT | DSE | 0.752833 | 3 | 0 | 3 |
| PLAT | RAB11FIP5 | 0.690402 | 3 | 0 | 3 |
| PLAT | GSR | 0.685578 | 3 | 0 | 3 |
| PLAT | CCNK | 0.678606 | 3 | 0 | 3 |
| PLAT | TM2D3 | 0.677532 | 3 | 0 | 3 |
| PLAT | LRP4 | 0.672186 | 3 | 0 | 3 |
| PLAT | UXS1 | 0.671501 | 4 | 0 | 4 |
| PLAT | CXCL5 | 0.667939 | 5 | 0 | 3 |
| PLAT | HSD17B2 | 0.667823 | 4 | 0 | 4 |
| PLAT | PHF5A | 0.666059 | 3 | 0 | 3 |
| PLAT | GOPC | 0.664015 | 4 | 0 | 3 |
| PLAT | PYCR2 | 0.661386 | 3 | 0 | 3 |
| PLAT | STEAP1B | 0.656253 | 4 | 0 | 3 |
| PLAT | LCAT | 0.652548 | 3 | 0 | 3 |
| PLAT | PTGS2 | 0.652097 | 4 | 0 | 4 |
| PLAT | ATM | 0.651131 | 3 | 0 | 3 |
| PLAT | FBXL4 | 0.649551 | 4 | 0 | 3 |
| PLAT | CYP20A1 | 0.647653 | 3 | 0 | 3 |
| PLAT | RWDD2A | 0.645243 | 3 | 0 | 3 |
For details and further investigation, click here