| Full name: phorbol-12-myristate-13-acetate-induced protein 1 | Alias Symbol: APR|NOXA | ||
| Type: protein-coding gene | Cytoband: 18q21.32 | ||
| Entrez ID: 5366 | HGNC ID: HGNC:9108 | Ensembl Gene: ENSG00000141682 | OMIM ID: 604959 |
| Related drugs: BORTEZOMIB... [more] | |||
PMAIP1 involved pathways:
| KEGG pathway | Description | View |
|---|---|---|
| hsa04115 | p53 signaling pathway | |
| hsa04210 | Apoptosis |
Expression of PMAIP1:
| Dataset | Gene | EntrezID | Probe | Log2FC | Adj.pValue | Expression |
|---|---|---|---|---|---|---|
| GSE17351 | PMAIP1 | 5366 | 204285_s_at | 0.1555 | 0.9194 | |
| GSE20347 | PMAIP1 | 5366 | 204285_s_at | 0.4501 | 0.1992 | |
| GSE23400 | PMAIP1 | 5366 | 204285_s_at | 0.2540 | 0.1248 | |
| GSE26886 | PMAIP1 | 5366 | 204286_s_at | -1.4805 | 0.0014 | |
| GSE29001 | PMAIP1 | 5366 | 204285_s_at | 0.3380 | 0.5163 | |
| GSE38129 | PMAIP1 | 5366 | 204285_s_at | 1.0132 | 0.0057 | |
| GSE45670 | PMAIP1 | 5366 | 204285_s_at | 1.0174 | 0.0015 | |
| GSE53622 | PMAIP1 | 5366 | 24037 | 0.7051 | 0.0000 | |
| GSE53624 | PMAIP1 | 5366 | 24037 | 0.6430 | 0.0000 | |
| GSE63941 | PMAIP1 | 5366 | 204285_s_at | 1.6927 | 0.0071 | |
| GSE77861 | PMAIP1 | 5366 | 204285_s_at | 0.8105 | 0.2287 | |
| GSE97050 | PMAIP1 | 5366 | A_33_P3619171 | 0.2760 | 0.5143 | |
| SRP007169 | PMAIP1 | 5366 | RNAseq | -0.8064 | 0.1197 | |
| SRP008496 | PMAIP1 | 5366 | RNAseq | -1.1235 | 0.0133 | |
| SRP064894 | PMAIP1 | 5366 | RNAseq | 0.3086 | 0.4915 | |
| SRP133303 | PMAIP1 | 5366 | RNAseq | 0.7964 | 0.0295 | |
| SRP159526 | PMAIP1 | 5366 | RNAseq | 0.1427 | 0.6841 | |
| SRP193095 | PMAIP1 | 5366 | RNAseq | -0.5482 | 0.1306 | |
| SRP219564 | PMAIP1 | 5366 | RNAseq | 0.1110 | 0.8799 | |
| TCGA | PMAIP1 | 5366 | RNAseq | 0.7458 | 0.0000 |
Upregulated datasets: 3; Downregulated datasets: 2.
Survival by PMAIP1 expression:
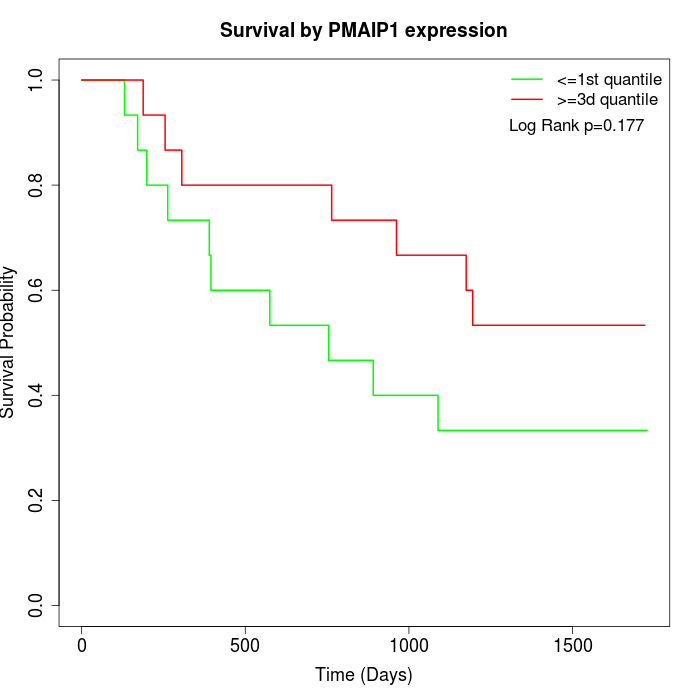 | 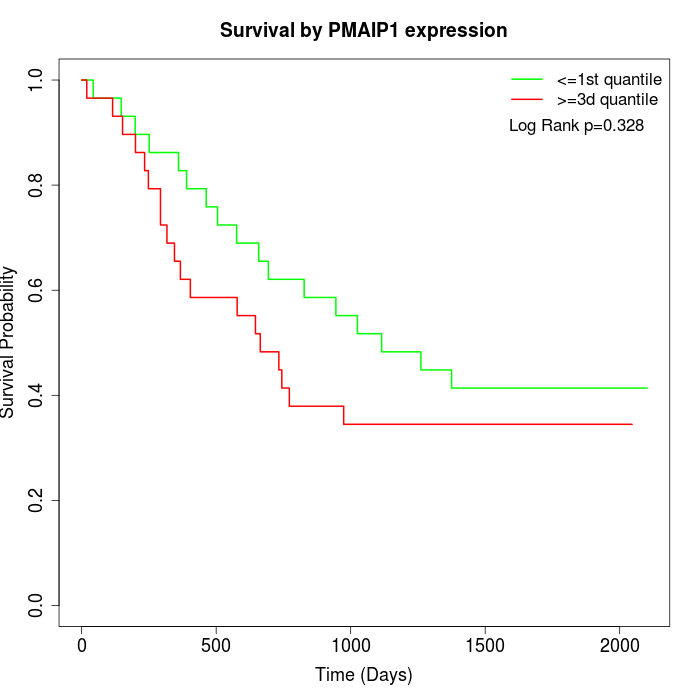 | 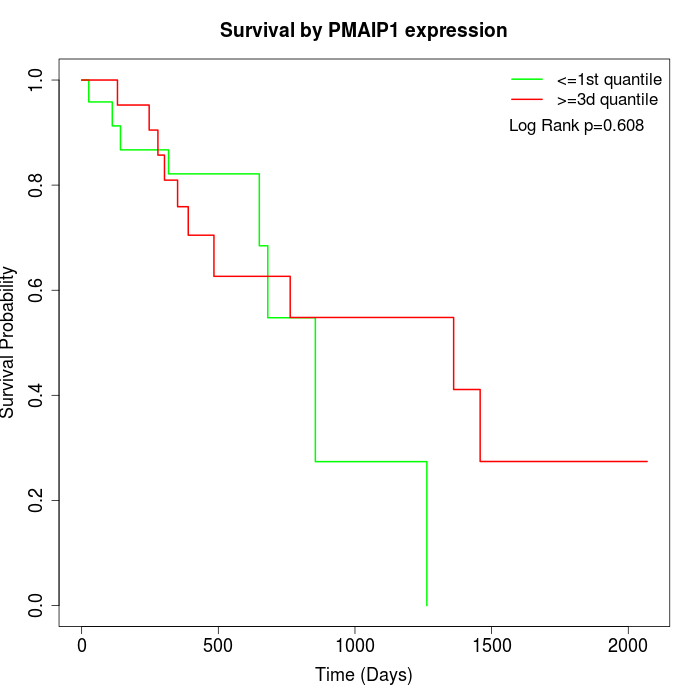 |
| GSE53622 | GSE53624 | TCGA |
Note: Click image to view full size file.
Copy number change of PMAIP1:
| Dataset | Gene | EntrezID | Gain | Loss | Normal | Detail |
|---|---|---|---|---|---|---|
| GSE15526 | PMAIP1 | 5366 | 1 | 9 | 20 | |
| GSE20123 | PMAIP1 | 5366 | 1 | 9 | 20 | |
| GSE43470 | PMAIP1 | 5366 | 0 | 5 | 38 | |
| GSE46452 | PMAIP1 | 5366 | 1 | 26 | 32 | |
| GSE47630 | PMAIP1 | 5366 | 5 | 20 | 15 | |
| GSE54993 | PMAIP1 | 5366 | 10 | 0 | 60 | |
| GSE54994 | PMAIP1 | 5366 | 1 | 17 | 35 | |
| GSE60625 | PMAIP1 | 5366 | 0 | 4 | 7 | |
| GSE74703 | PMAIP1 | 5366 | 0 | 5 | 31 | |
| GSE74704 | PMAIP1 | 5366 | 1 | 6 | 13 | |
| TCGA | PMAIP1 | 5366 | 9 | 44 | 43 |
Total number of gains: 29; Total number of losses: 145; Total Number of normals: 314.
Somatic mutations of PMAIP1:
Generating mutation plots.
Highly correlated genes for PMAIP1:
Showing top 20/58 corelated genes with mean PCC>0.5.
| Gene1 | Gene2 | Mean PCC | Num. Datasets | Num. PCC<0 | Num. PCC>0.5 |
|---|---|---|---|---|---|
| PMAIP1 | NME9 | 0.658204 | 3 | 0 | 3 |
| PMAIP1 | RPRD1A | 0.643672 | 3 | 0 | 3 |
| PMAIP1 | RASGEF1B | 0.633486 | 3 | 0 | 3 |
| PMAIP1 | RNGTT | 0.63005 | 4 | 0 | 4 |
| PMAIP1 | GSTA3 | 0.629307 | 3 | 0 | 3 |
| PMAIP1 | GRPEL1 | 0.611956 | 3 | 0 | 3 |
| PMAIP1 | GGH | 0.608644 | 5 | 0 | 4 |
| PMAIP1 | PPAT | 0.597667 | 3 | 0 | 3 |
| PMAIP1 | LPAR3 | 0.595351 | 3 | 0 | 3 |
| PMAIP1 | GNL3L | 0.592475 | 3 | 0 | 3 |
| PMAIP1 | EDEM1 | 0.586262 | 3 | 0 | 3 |
| PMAIP1 | WTAP | 0.579895 | 3 | 0 | 3 |
| PMAIP1 | TUBGCP4 | 0.571529 | 4 | 0 | 3 |
| PMAIP1 | UCK2 | 0.567005 | 3 | 0 | 3 |
| PMAIP1 | CCNB2 | 0.557993 | 7 | 0 | 4 |
| PMAIP1 | POLR1C | 0.556383 | 3 | 0 | 3 |
| PMAIP1 | CEP85 | 0.554714 | 5 | 0 | 3 |
| PMAIP1 | JAG1 | 0.553498 | 3 | 0 | 3 |
| PMAIP1 | KIF20A | 0.553179 | 5 | 0 | 3 |
| PMAIP1 | BIRC5 | 0.547039 | 6 | 0 | 4 |
For details and further investigation, click here