| Full name: lysophosphatidic acid receptor 3 | Alias Symbol: LP-A3|Edg-7|RP4-678I3|HOFNH30|LPA3 | ||
| Type: protein-coding gene | Cytoband: 1p22.3 | ||
| Entrez ID: 23566 | HGNC ID: HGNC:14298 | Ensembl Gene: ENSG00000171517 | OMIM ID: 605106 |
| Related drugs: CHEMBL1395060, CYCLOPENTOLATE, CYCLOPHOSPHAMIDE, CYCLOSPORINE, CYPROHEPTADINE, FARNESYL DIPHOSPHATE, PROSCILLARIDIN... [more] | |||
LPAR3 involved pathways:
| KEGG pathway | Description | View |
|---|---|---|
| hsa04015 | Rap1 signaling pathway | |
| hsa04072 | Phospholipase D signaling pathway | |
| hsa04151 | PI3K-Akt signaling pathway |
Expression of LPAR3:
| Dataset | Gene | EntrezID | Probe | Log2FC | Adj.pValue | Expression |
|---|---|---|---|---|---|---|
| GSE17351 | LPAR3 | 23566 | 231192_at | 0.0988 | 0.9518 | |
| GSE20347 | LPAR3 | 23566 | 220816_at | 0.0101 | 0.9407 | |
| GSE23400 | LPAR3 | 23566 | 220816_at | 0.2257 | 0.0016 | |
| GSE26886 | LPAR3 | 23566 | 231192_at | 0.9346 | 0.0318 | |
| GSE29001 | LPAR3 | 23566 | 220816_at | -0.1542 | 0.2390 | |
| GSE38129 | LPAR3 | 23566 | 220816_at | 0.1727 | 0.2380 | |
| GSE45670 | LPAR3 | 23566 | 231192_at | 0.9649 | 0.0100 | |
| GSE53622 | LPAR3 | 23566 | 50780 | 0.5194 | 0.0811 | |
| GSE53624 | LPAR3 | 23566 | 50780 | 0.4664 | 0.0008 | |
| GSE63941 | LPAR3 | 23566 | 231192_at | -1.4192 | 0.4083 | |
| GSE77861 | LPAR3 | 23566 | 231192_at | 0.5370 | 0.2463 | |
| GSE97050 | LPAR3 | 23566 | A_23_P436048 | 1.0679 | 0.2714 | |
| SRP007169 | LPAR3 | 23566 | RNAseq | 0.8155 | 0.1254 | |
| SRP008496 | LPAR3 | 23566 | RNAseq | 0.4729 | 0.1820 | |
| SRP064894 | LPAR3 | 23566 | RNAseq | 0.6971 | 0.0870 | |
| SRP133303 | LPAR3 | 23566 | RNAseq | 0.6352 | 0.0709 | |
| SRP159526 | LPAR3 | 23566 | RNAseq | -0.4348 | 0.4008 | |
| SRP193095 | LPAR3 | 23566 | RNAseq | 0.2446 | 0.4214 | |
| SRP219564 | LPAR3 | 23566 | RNAseq | 0.8718 | 0.4069 | |
| TCGA | LPAR3 | 23566 | RNAseq | 1.5878 | 0.0000 |
Upregulated datasets: 1; Downregulated datasets: 0.
Survival by LPAR3 expression:
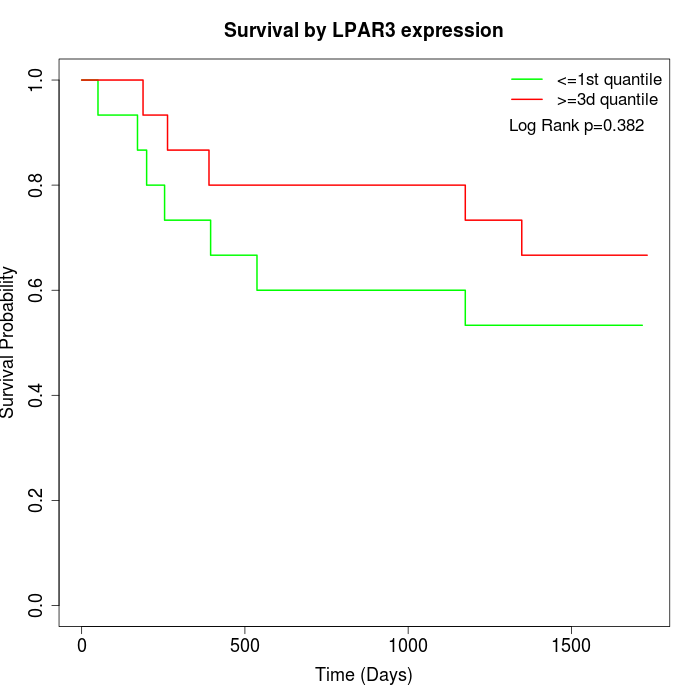 |  | 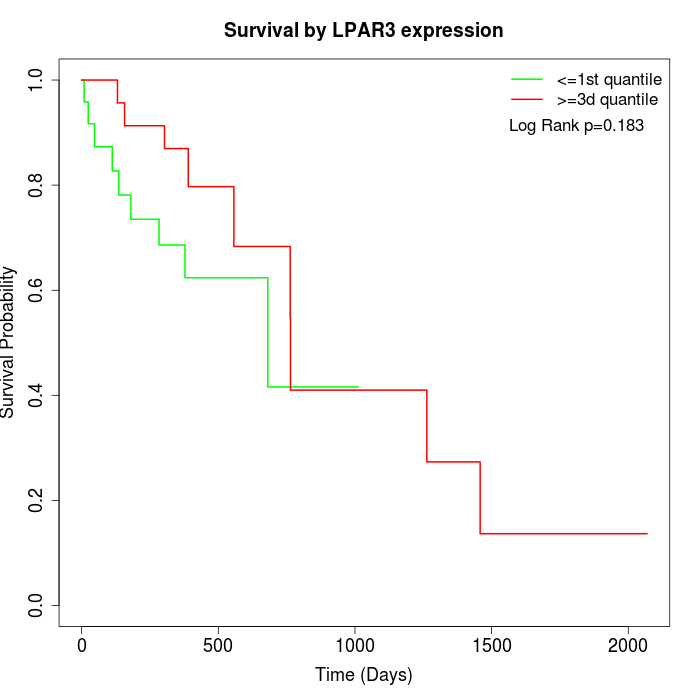 |
| GSE53622 | GSE53624 | TCGA |
Note: Click image to view full size file.
Copy number change of LPAR3:
| Dataset | Gene | EntrezID | Gain | Loss | Normal | Detail |
|---|---|---|---|---|---|---|
| GSE15526 | LPAR3 | 23566 | 0 | 8 | 22 | |
| GSE20123 | LPAR3 | 23566 | 0 | 8 | 22 | |
| GSE43470 | LPAR3 | 23566 | 2 | 2 | 39 | |
| GSE46452 | LPAR3 | 23566 | 0 | 1 | 58 | |
| GSE47630 | LPAR3 | 23566 | 8 | 5 | 27 | |
| GSE54993 | LPAR3 | 23566 | 0 | 0 | 70 | |
| GSE54994 | LPAR3 | 23566 | 6 | 3 | 44 | |
| GSE60625 | LPAR3 | 23566 | 0 | 0 | 11 | |
| GSE74703 | LPAR3 | 23566 | 1 | 2 | 33 | |
| GSE74704 | LPAR3 | 23566 | 0 | 5 | 15 | |
| TCGA | LPAR3 | 23566 | 7 | 23 | 66 |
Total number of gains: 24; Total number of losses: 57; Total Number of normals: 407.
Somatic mutations of LPAR3:
Generating mutation plots.
Highly correlated genes for LPAR3:
Showing top 20/530 corelated genes with mean PCC>0.5.
| Gene1 | Gene2 | Mean PCC | Num. Datasets | Num. PCC<0 | Num. PCC>0.5 |
|---|---|---|---|---|---|
| LPAR3 | PAPPA | 0.7521 | 3 | 0 | 3 |
| LPAR3 | ZNF114 | 0.73748 | 3 | 0 | 3 |
| LPAR3 | SFR1 | 0.722522 | 3 | 0 | 3 |
| LPAR3 | INHBA | 0.710098 | 3 | 0 | 3 |
| LPAR3 | C12orf75 | 0.702962 | 3 | 0 | 3 |
| LPAR3 | PTPN12 | 0.700992 | 4 | 0 | 4 |
| LPAR3 | SDF4 | 0.687799 | 3 | 0 | 3 |
| LPAR3 | TNIP3 | 0.687161 | 3 | 0 | 3 |
| LPAR3 | BOLA3 | 0.684505 | 3 | 0 | 3 |
| LPAR3 | ADCY7 | 0.683478 | 3 | 0 | 3 |
| LPAR3 | UHMK1 | 0.682345 | 3 | 0 | 3 |
| LPAR3 | MCTP1 | 0.679361 | 4 | 0 | 3 |
| LPAR3 | SNRNP200 | 0.678538 | 3 | 0 | 3 |
| LPAR3 | FAM126A | 0.678247 | 5 | 0 | 3 |
| LPAR3 | NUS1 | 0.672378 | 3 | 0 | 3 |
| LPAR3 | LPCAT3 | 0.668112 | 3 | 0 | 3 |
| LPAR3 | JAG1 | 0.667996 | 3 | 0 | 3 |
| LPAR3 | MICALCL | 0.666321 | 3 | 0 | 3 |
| LPAR3 | MOB3A | 0.664237 | 3 | 0 | 3 |
| LPAR3 | FAM83G | 0.664195 | 4 | 0 | 3 |
For details and further investigation, click here