| Full name: PMS1 homolog 2, mismatch repair system component | Alias Symbol: H_DJ0042M02.9|HNPCC4|MLH4 | ||
| Type: protein-coding gene | Cytoband: 7p22.1 | ||
| Entrez ID: 5395 | HGNC ID: HGNC:9122 | Ensembl Gene: ENSG00000122512 | OMIM ID: 600259 |
| Related drugs: ATEZOLIZUMAB, IPILIMUMAB, NIVOLUMAB, PEMBROLIZUMAB... [more] | |||
Screen Evidence:
| |||
PMS2 involved pathways:
| KEGG pathway | Description | View |
|---|---|---|
| hsa03460 | Fanconi anemia pathway |
Expression of PMS2:
| Dataset | Gene | EntrezID | Probe | Log2FC | Adj.pValue | Expression |
|---|---|---|---|---|---|---|
| GSE53622 | PMS2 | 5395 | 52442 | 0.5321 | 0.0000 | |
| GSE53624 | PMS2 | 5395 | 52442 | 0.4334 | 0.0000 | |
| GSE97050 | PMS2 | 5395 | A_23_P93792 | 0.3019 | 0.4652 | |
| SRP007169 | PMS2 | 5395 | RNAseq | 0.0405 | 0.9227 | |
| SRP008496 | PMS2 | 5395 | RNAseq | 0.5986 | 0.0285 | |
| SRP064894 | PMS2 | 5395 | RNAseq | 0.3703 | 0.0079 | |
| SRP133303 | PMS2 | 5395 | RNAseq | 0.2162 | 0.0917 | |
| SRP159526 | PMS2 | 5395 | RNAseq | 0.3706 | 0.2168 | |
| SRP193095 | PMS2 | 5395 | RNAseq | 0.1448 | 0.1111 | |
| SRP219564 | PMS2 | 5395 | RNAseq | 0.2945 | 0.4894 | |
| TCGA | PMS2 | 5395 | RNAseq | 0.2249 | 0.0001 |
Upregulated datasets: 0; Downregulated datasets: 0.
Survival by PMS2 expression:
 | 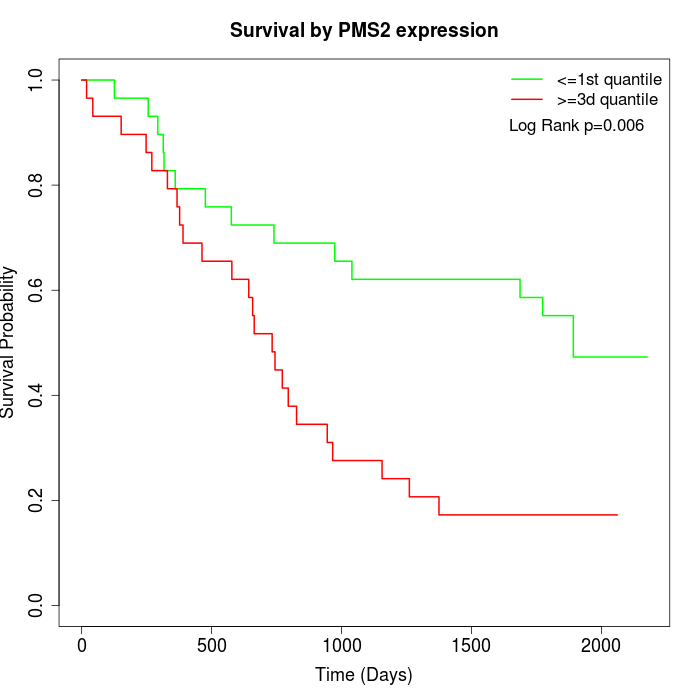 | 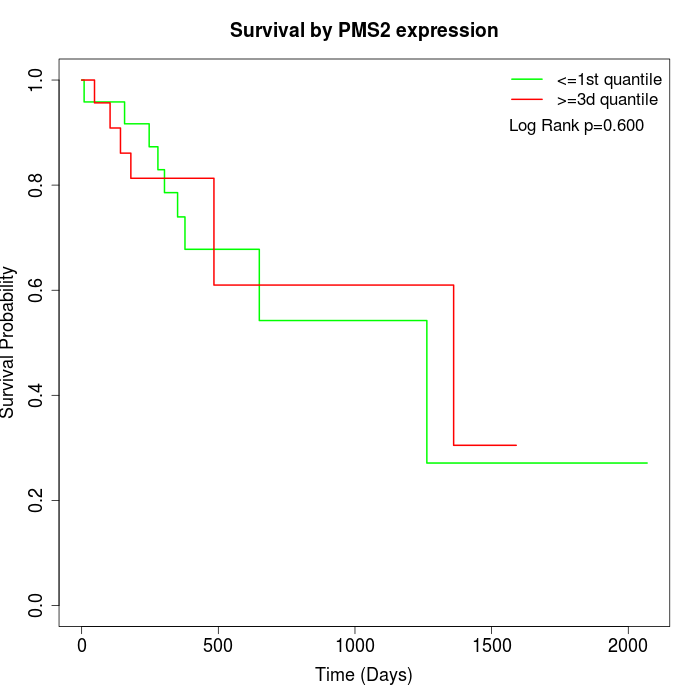 |
| GSE53622 | GSE53624 | TCGA |
Note: Click image to view full size file.
Copy number change of PMS2:
| Dataset | Gene | EntrezID | Gain | Loss | Normal | Detail |
|---|---|---|---|---|---|---|
| GSE15526 | PMS2 | 5395 | 14 | 1 | 15 | |
| GSE20123 | PMS2 | 5395 | 14 | 1 | 15 | |
| GSE43470 | PMS2 | 5395 | 6 | 1 | 36 | |
| GSE46452 | PMS2 | 5395 | 13 | 1 | 45 | |
| GSE47630 | PMS2 | 5395 | 9 | 1 | 30 | |
| GSE54993 | PMS2 | 5395 | 0 | 6 | 64 | |
| GSE54994 | PMS2 | 5395 | 20 | 1 | 32 | |
| GSE60625 | PMS2 | 5395 | 0 | 0 | 11 | |
| GSE74703 | PMS2 | 5395 | 6 | 0 | 30 | |
| GSE74704 | PMS2 | 5395 | 9 | 0 | 11 | |
| TCGA | PMS2 | 5395 | 55 | 5 | 36 |
Total number of gains: 146; Total number of losses: 17; Total Number of normals: 325.
Somatic mutations of PMS2:
Generating mutation plots.
Highly correlated genes for PMS2:
Showing top 20/315 corelated genes with mean PCC>0.5.
| Gene1 | Gene2 | Mean PCC | Num. Datasets | Num. PCC<0 | Num. PCC>0.5 |
|---|---|---|---|---|---|
| PMS2 | EIF2AK1 | 0.799924 | 3 | 0 | 3 |
| PMS2 | DDX56 | 0.787504 | 3 | 0 | 3 |
| PMS2 | PSMG3 | 0.776529 | 3 | 0 | 3 |
| PMS2 | TTC30B | 0.760484 | 3 | 0 | 3 |
| PMS2 | KDM1A | 0.749772 | 3 | 0 | 3 |
| PMS2 | KLHL11 | 0.743418 | 3 | 0 | 3 |
| PMS2 | TBRG4 | 0.740097 | 3 | 0 | 3 |
| PMS2 | FAM200A | 0.735622 | 3 | 0 | 3 |
| PMS2 | BRAT1 | 0.734157 | 3 | 0 | 3 |
| PMS2 | PAQR4 | 0.732347 | 3 | 0 | 3 |
| PMS2 | WDR54 | 0.730918 | 3 | 0 | 3 |
| PMS2 | KLHL7 | 0.729049 | 3 | 0 | 3 |
| PMS2 | SASS6 | 0.728626 | 3 | 0 | 3 |
| PMS2 | THOC5 | 0.72709 | 3 | 0 | 3 |
| PMS2 | POLA2 | 0.726676 | 3 | 0 | 3 |
| PMS2 | ADAT1 | 0.726656 | 3 | 0 | 3 |
| PMS2 | MASTL | 0.724858 | 3 | 0 | 3 |
| PMS2 | ISG20L2 | 0.723529 | 3 | 0 | 3 |
| PMS2 | MRPL47 | 0.722847 | 3 | 0 | 3 |
| PMS2 | TFAP4 | 0.722783 | 3 | 0 | 3 |
For details and further investigation, click here