| Full name: DNA polymerase epsilon 2, accessory subunit | Alias Symbol: DPE2 | ||
| Type: protein-coding gene | Cytoband: 14q21.3 | ||
| Entrez ID: 5427 | HGNC ID: HGNC:9178 | Ensembl Gene: ENSG00000100479 | OMIM ID: 602670 |
POLE2 involved pathways:
| KEGG pathway | Description | View |
|---|---|---|
| hsa05166 | HTLV-I infection |
Expression of POLE2:
| Dataset | Gene | EntrezID | Probe | Log2FC | Adj.pValue | Expression |
|---|---|---|---|---|---|---|
| GSE17351 | POLE2 | 5427 | 205909_at | 1.3883 | 0.1922 | |
| GSE20347 | POLE2 | 5427 | 205909_at | 1.3365 | 0.0000 | |
| GSE23400 | POLE2 | 5427 | 205909_at | 0.8018 | 0.0000 | |
| GSE26886 | POLE2 | 5427 | 205909_at | 0.5038 | 0.0978 | |
| GSE29001 | POLE2 | 5427 | 205909_at | 1.1762 | 0.0020 | |
| GSE38129 | POLE2 | 5427 | 205909_at | 1.5555 | 0.0000 | |
| GSE45670 | POLE2 | 5427 | 205909_at | 0.9479 | 0.0004 | |
| GSE53622 | POLE2 | 5427 | 78492 | 1.1049 | 0.0000 | |
| GSE53624 | POLE2 | 5427 | 87136 | 1.0694 | 0.0000 | |
| GSE63941 | POLE2 | 5427 | 205909_at | 3.2044 | 0.0001 | |
| GSE77861 | POLE2 | 5427 | 205909_at | 0.8021 | 0.1056 | |
| GSE97050 | POLE2 | 5427 | A_23_P163099 | 0.7371 | 0.1453 | |
| SRP007169 | POLE2 | 5427 | RNAseq | 0.6525 | 0.1657 | |
| SRP008496 | POLE2 | 5427 | RNAseq | 0.2115 | 0.5358 | |
| SRP064894 | POLE2 | 5427 | RNAseq | 0.8450 | 0.0004 | |
| SRP133303 | POLE2 | 5427 | RNAseq | 1.0659 | 0.0000 | |
| SRP159526 | POLE2 | 5427 | RNAseq | 0.5692 | 0.1830 | |
| SRP193095 | POLE2 | 5427 | RNAseq | 0.6052 | 0.0002 | |
| SRP219564 | POLE2 | 5427 | RNAseq | 1.3695 | 0.0421 | |
| TCGA | POLE2 | 5427 | RNAseq | 1.1432 | 0.0000 |
Upregulated datasets: 9; Downregulated datasets: 0.
Survival by POLE2 expression:
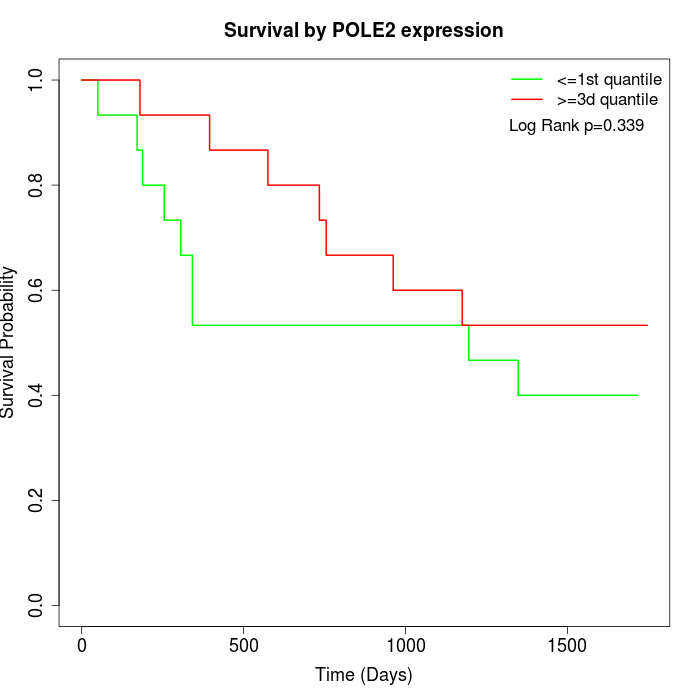 | 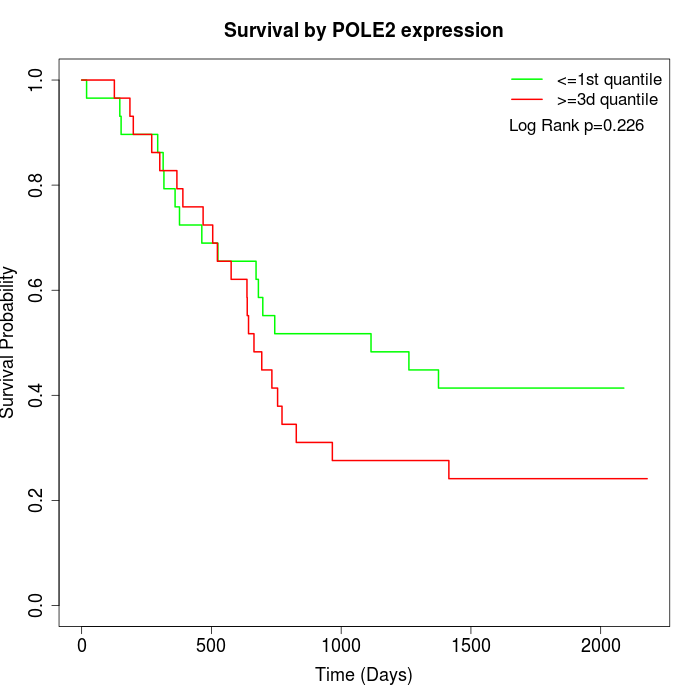 | 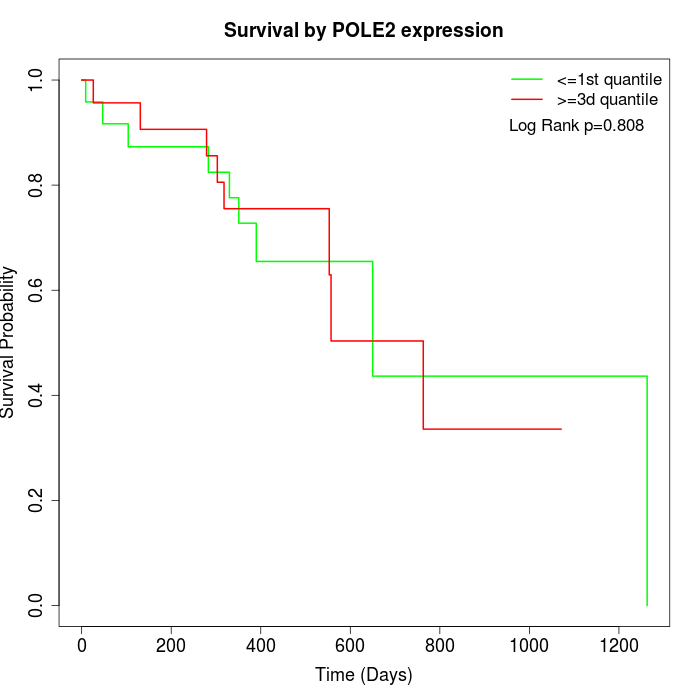 |
| GSE53622 | GSE53624 | TCGA |
Note: Click image to view full size file.
Copy number change of POLE2:
| Dataset | Gene | EntrezID | Gain | Loss | Normal | Detail |
|---|---|---|---|---|---|---|
| GSE15526 | POLE2 | 5427 | 7 | 2 | 21 | |
| GSE20123 | POLE2 | 5427 | 7 | 3 | 20 | |
| GSE43470 | POLE2 | 5427 | 9 | 1 | 33 | |
| GSE46452 | POLE2 | 5427 | 16 | 3 | 40 | |
| GSE47630 | POLE2 | 5427 | 11 | 10 | 19 | |
| GSE54993 | POLE2 | 5427 | 3 | 9 | 58 | |
| GSE54994 | POLE2 | 5427 | 19 | 4 | 30 | |
| GSE60625 | POLE2 | 5427 | 0 | 2 | 9 | |
| GSE74703 | POLE2 | 5427 | 7 | 1 | 28 | |
| GSE74704 | POLE2 | 5427 | 2 | 2 | 16 | |
| TCGA | POLE2 | 5427 | 34 | 13 | 49 |
Total number of gains: 115; Total number of losses: 50; Total Number of normals: 323.
Somatic mutations of POLE2:
Generating mutation plots.
Highly correlated genes for POLE2:
Showing top 20/772 corelated genes with mean PCC>0.5.
| Gene1 | Gene2 | Mean PCC | Num. Datasets | Num. PCC<0 | Num. PCC>0.5 |
|---|---|---|---|---|---|
| POLE2 | LRR1 | 0.865409 | 7 | 0 | 7 |
| POLE2 | CDKN3 | 0.804859 | 12 | 0 | 12 |
| POLE2 | DLGAP5 | 0.796814 | 13 | 0 | 12 |
| POLE2 | C1orf112 | 0.78091 | 8 | 0 | 8 |
| POLE2 | CDC20 | 0.780102 | 12 | 0 | 12 |
| POLE2 | BUB1B | 0.779357 | 10 | 0 | 10 |
| POLE2 | CDC6 | 0.772318 | 10 | 0 | 10 |
| POLE2 | GINS1 | 0.770586 | 11 | 0 | 11 |
| POLE2 | CDCA2 | 0.767457 | 5 | 0 | 5 |
| POLE2 | TPX2 | 0.764144 | 11 | 0 | 10 |
| POLE2 | VRK1 | 0.759734 | 12 | 0 | 12 |
| POLE2 | RAD51AP1 | 0.757471 | 12 | 0 | 12 |
| POLE2 | CENPN | 0.753642 | 12 | 0 | 11 |
| POLE2 | KIF2C | 0.749609 | 12 | 0 | 12 |
| POLE2 | NUBP1 | 0.748984 | 3 | 0 | 3 |
| POLE2 | STIL | 0.743768 | 11 | 0 | 10 |
| POLE2 | CDCA5 | 0.743153 | 8 | 0 | 8 |
| POLE2 | DEPDC1B | 0.741432 | 8 | 0 | 8 |
| POLE2 | NUSAP1 | 0.740807 | 10 | 0 | 10 |
| POLE2 | UBE2C | 0.740135 | 11 | 0 | 10 |
For details and further investigation, click here