| Full name: patched 1 | Alias Symbol: BCNS | ||
| Type: protein-coding gene | Cytoband: 9q22.32 | ||
| Entrez ID: 5727 | HGNC ID: HGNC:9585 | Ensembl Gene: ENSG00000185920 | OMIM ID: 601309 |
| Related drugs: ERISMODEGIB, FORETINIB, TRETINOIN, VISMODEGIB... [more] | |||
Screen Evidence:
| |||
PTCH1 involved pathways:
| KEGG pathway | Description | View |
|---|---|---|
| hsa04024 | cAMP signaling pathway | |
| hsa04340 | Hedgehog signaling pathway | |
| hsa04360 | Axon guidance | |
| hsa05200 | Pathways in cancer | |
| hsa05217 | Basal cell carcinoma |
Expression of PTCH1:
| Dataset | Gene | EntrezID | Probe | Log2FC | Adj.pValue | Expression |
|---|---|---|---|---|---|---|
| GSE17351 | PTCH1 | 5727 | 209815_at | -0.3433 | 0.7020 | |
| GSE20347 | PTCH1 | 5727 | 209815_at | 0.5862 | 0.0827 | |
| GSE23400 | PTCH1 | 5727 | 209815_at | 0.5033 | 0.0335 | |
| GSE26886 | PTCH1 | 5727 | 209815_at | 1.3497 | 0.0123 | |
| GSE29001 | PTCH1 | 5727 | 209815_at | 0.0279 | 0.9594 | |
| GSE38129 | PTCH1 | 5727 | 209815_at | 0.2683 | 0.4951 | |
| GSE45670 | PTCH1 | 5727 | 209815_at | -0.4813 | 0.3467 | |
| GSE53622 | PTCH1 | 5727 | 9752 | 0.2000 | 0.1694 | |
| GSE53624 | PTCH1 | 5727 | 7742 | -1.7866 | 0.0000 | |
| GSE63941 | PTCH1 | 5727 | 209815_at | -1.8069 | 0.0244 | |
| GSE97050 | PTCH1 | 5727 | A_33_P3239112 | -0.3199 | 0.2247 | |
| SRP007169 | PTCH1 | 5727 | RNAseq | 3.2278 | 0.0000 | |
| SRP064894 | PTCH1 | 5727 | RNAseq | -0.3610 | 0.0998 | |
| SRP133303 | PTCH1 | 5727 | RNAseq | -0.5125 | 0.0014 | |
| SRP159526 | PTCH1 | 5727 | RNAseq | 1.2886 | 0.0031 | |
| SRP193095 | PTCH1 | 5727 | RNAseq | 0.2226 | 0.4851 | |
| SRP219564 | PTCH1 | 5727 | RNAseq | -0.1850 | 0.7308 | |
| TCGA | PTCH1 | 5727 | RNAseq | -0.3063 | 0.0248 |
Upregulated datasets: 3; Downregulated datasets: 2.
Survival by PTCH1 expression:
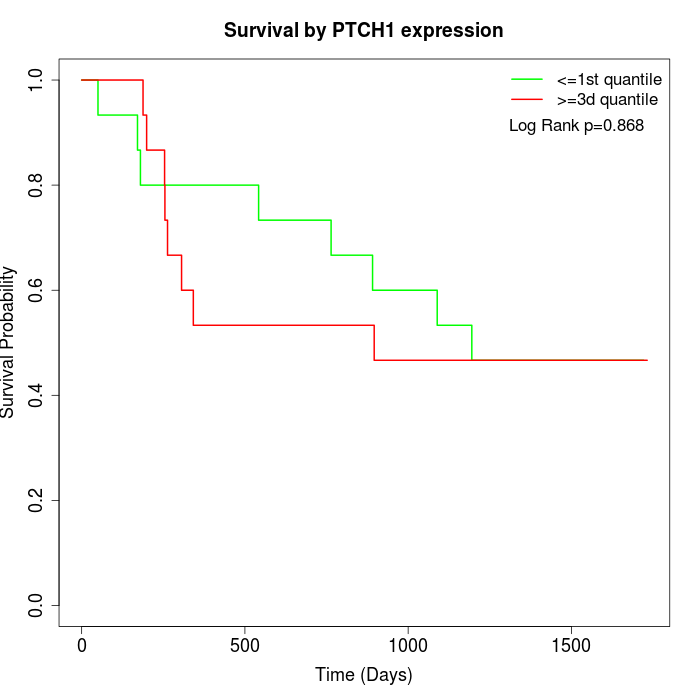 | 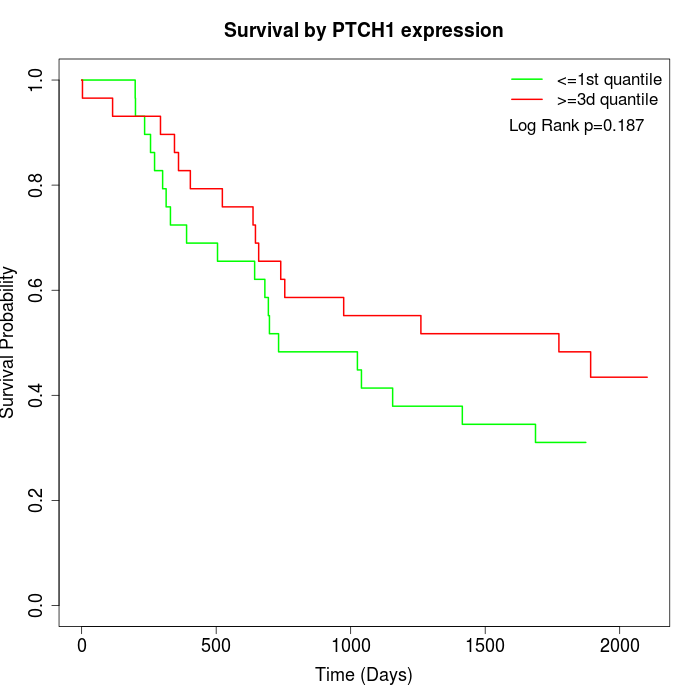 | 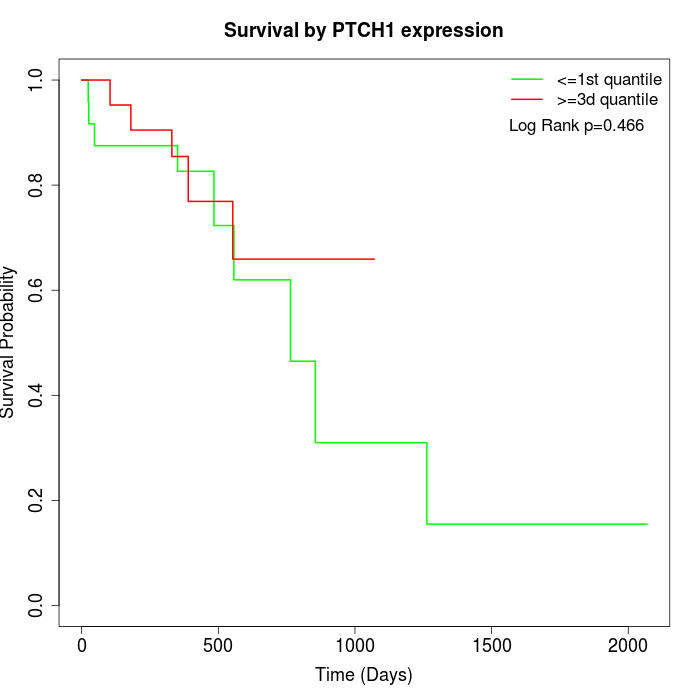 |
| GSE53622 | GSE53624 | TCGA |
Note: Click image to view full size file.
Copy number change of PTCH1:
| Dataset | Gene | EntrezID | Gain | Loss | Normal | Detail |
|---|---|---|---|---|---|---|
| GSE15526 | PTCH1 | 5727 | 6 | 7 | 17 | |
| GSE20123 | PTCH1 | 5727 | 6 | 7 | 17 | |
| GSE43470 | PTCH1 | 5727 | 6 | 3 | 34 | |
| GSE46452 | PTCH1 | 5727 | 6 | 14 | 39 | |
| GSE47630 | PTCH1 | 5727 | 1 | 17 | 22 | |
| GSE54993 | PTCH1 | 5727 | 4 | 2 | 64 | |
| GSE54994 | PTCH1 | 5727 | 8 | 11 | 34 | |
| GSE60625 | PTCH1 | 5727 | 0 | 0 | 11 | |
| GSE74703 | PTCH1 | 5727 | 5 | 3 | 28 | |
| GSE74704 | PTCH1 | 5727 | 3 | 5 | 12 | |
| TCGA | PTCH1 | 5727 | 24 | 23 | 49 |
Total number of gains: 69; Total number of losses: 92; Total Number of normals: 327.
Somatic mutations of PTCH1:
Generating mutation plots.
Highly correlated genes for PTCH1:
Showing top 20/37 corelated genes with mean PCC>0.5.
| Gene1 | Gene2 | Mean PCC | Num. Datasets | Num. PCC<0 | Num. PCC>0.5 |
|---|---|---|---|---|---|
| PTCH1 | AQP5 | 0.761018 | 3 | 0 | 3 |
| PTCH1 | NCR1 | 0.727519 | 3 | 0 | 3 |
| PTCH1 | SCARA5 | 0.673665 | 3 | 0 | 3 |
| PTCH1 | JAKMIP3 | 0.652774 | 3 | 0 | 3 |
| PTCH1 | IVD | 0.624447 | 3 | 0 | 3 |
| PTCH1 | KIAA1549L | 0.62117 | 3 | 0 | 3 |
| PTCH1 | C12orf42 | 0.619081 | 3 | 0 | 3 |
| PTCH1 | KCNK12 | 0.61893 | 3 | 0 | 3 |
| PTCH1 | PAX2 | 0.618278 | 3 | 0 | 3 |
| PTCH1 | MAP3K7CL | 0.587543 | 3 | 0 | 3 |
| PTCH1 | PTGDS | 0.580067 | 4 | 0 | 3 |
| PTCH1 | GSTM5 | 0.575638 | 3 | 0 | 3 |
| PTCH1 | ANXA10 | 0.574178 | 3 | 0 | 3 |
| PTCH1 | CNTN4 | 0.571042 | 4 | 0 | 3 |
| PTCH1 | ZNF678 | 0.563369 | 3 | 0 | 3 |
| PTCH1 | GPC3 | 0.561751 | 8 | 0 | 5 |
| PTCH1 | SNRK-AS1 | 0.560778 | 3 | 0 | 3 |
| PTCH1 | NTF3 | 0.557812 | 4 | 0 | 3 |
| PTCH1 | FAM110B | 0.552138 | 4 | 0 | 3 |
| PTCH1 | TRAM1L1 | 0.549352 | 3 | 0 | 3 |
For details and further investigation, click here