| Full name: pituitary tumor-transforming 2 | Alias Symbol: | ||
| Type: protein-coding gene | Cytoband: 4p14 | ||
| Entrez ID: 10744 | HGNC ID: HGNC:9691 | Ensembl Gene: ENSG00000250254 | OMIM ID: 604231 |
PTTG2 involved pathways:
| KEGG pathway | Description | View |
|---|---|---|
| hsa04110 | Cell cycle | |
| hsa04114 | Oocyte meiosis | |
| hsa05166 | HTLV-I infection |
Expression of PTTG2:
| Dataset | Gene | EntrezID | Probe | Log2FC | Adj.pValue | Expression |
|---|---|---|---|---|---|---|
| GSE17351 | PTTG2 | 10744 | 214557_at | -0.1137 | 0.6659 | |
| GSE20347 | PTTG2 | 10744 | 214557_at | -0.1374 | 0.0194 | |
| GSE23400 | PTTG2 | 10744 | 214557_at | -0.0409 | 0.0627 | |
| GSE26886 | PTTG2 | 10744 | 214557_at | 0.0112 | 0.9244 | |
| GSE29001 | PTTG2 | 10744 | 214557_at | -0.1697 | 0.0710 | |
| GSE38129 | PTTG2 | 10744 | 214557_at | -0.1256 | 0.0108 | |
| GSE45670 | PTTG2 | 10744 | 214557_at | -0.0141 | 0.8839 | |
| GSE53622 | PTTG2 | 10744 | 42146 | 0.7883 | 0.0000 | |
| GSE53624 | PTTG2 | 10744 | 42146 | 1.0035 | 0.0000 | |
| GSE63941 | PTTG2 | 10744 | 214557_at | 0.1681 | 0.4086 | |
| GSE77861 | PTTG2 | 10744 | 214557_at | -0.1238 | 0.3339 | |
| GSE97050 | PTTG2 | 10744 | A_23_P18579 | 0.8483 | 0.1756 | |
| TCGA | PTTG2 | 10744 | RNAseq | -0.8632 | 0.1876 |
Upregulated datasets: 1; Downregulated datasets: 0.
Survival by PTTG2 expression:
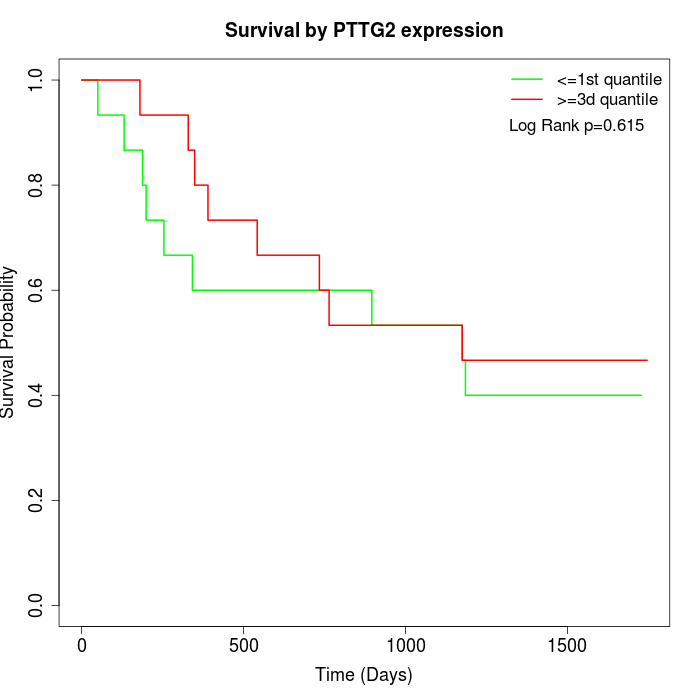 | 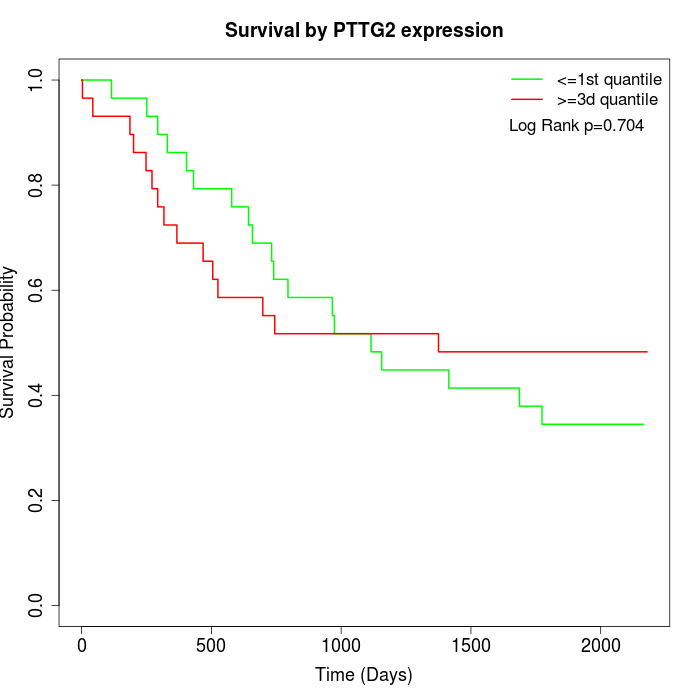 | 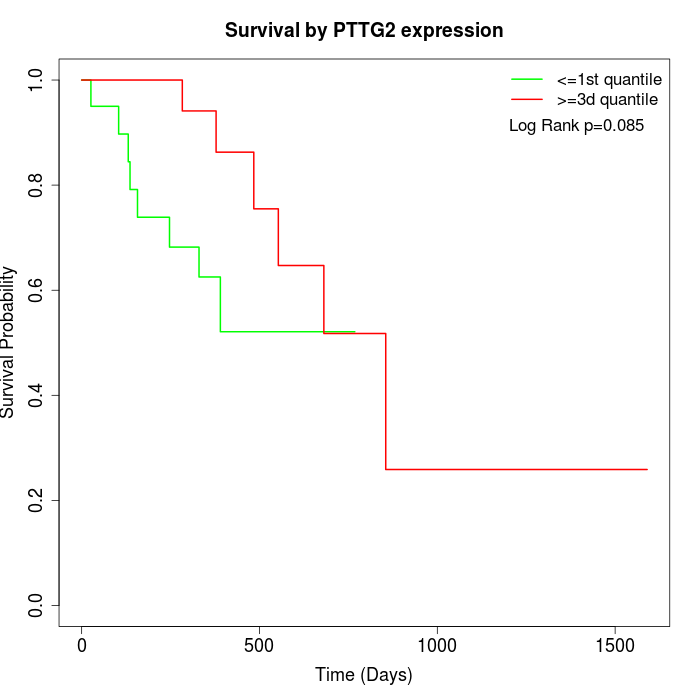 |
| GSE53622 | GSE53624 | TCGA |
Note: Click image to view full size file.
Copy number change of PTTG2:
| Dataset | Gene | EntrezID | Gain | Loss | Normal | Detail |
|---|---|---|---|---|---|---|
| GSE15526 | PTTG2 | 10744 | 0 | 16 | 14 | |
| GSE20123 | PTTG2 | 10744 | 0 | 16 | 14 | |
| GSE43470 | PTTG2 | 10744 | 2 | 13 | 28 | |
| GSE46452 | PTTG2 | 10744 | 1 | 36 | 22 | |
| GSE47630 | PTTG2 | 10744 | 1 | 19 | 20 | |
| GSE54993 | PTTG2 | 10744 | 8 | 0 | 62 | |
| GSE54994 | PTTG2 | 10744 | 4 | 10 | 39 | |
| GSE60625 | PTTG2 | 10744 | 0 | 0 | 11 | |
| GSE74703 | PTTG2 | 10744 | 1 | 11 | 24 | |
| GSE74704 | PTTG2 | 10744 | 0 | 9 | 11 | |
| TCGA | PTTG2 | 10744 | 11 | 45 | 40 |
Total number of gains: 28; Total number of losses: 175; Total Number of normals: 285.
Somatic mutations of PTTG2:
Generating mutation plots.
Highly correlated genes for PTTG2:
Showing top 20/98 corelated genes with mean PCC>0.5.
| Gene1 | Gene2 | Mean PCC | Num. Datasets | Num. PCC<0 | Num. PCC>0.5 |
|---|---|---|---|---|---|
| PTTG2 | CENPW | 0.734769 | 4 | 0 | 4 |
| PTTG2 | ESCO2 | 0.720736 | 4 | 0 | 4 |
| PTTG2 | PYCARD | 0.701867 | 3 | 0 | 3 |
| PTTG2 | MND1 | 0.697222 | 4 | 0 | 4 |
| PTTG2 | ULBP3 | 0.695647 | 4 | 0 | 4 |
| PTTG2 | CDC25C | 0.662239 | 5 | 0 | 5 |
| PTTG2 | DKC1 | 0.661975 | 3 | 0 | 3 |
| PTTG2 | PSMG3 | 0.65375 | 3 | 0 | 3 |
| PTTG2 | TICRR | 0.645881 | 3 | 0 | 3 |
| PTTG2 | GLRX3 | 0.643408 | 3 | 0 | 3 |
| PTTG2 | GRAP2 | 0.642533 | 3 | 0 | 3 |
| PTTG2 | RMI2 | 0.642046 | 3 | 0 | 3 |
| PTTG2 | MMS22L | 0.637923 | 3 | 0 | 3 |
| PTTG2 | UCK2 | 0.635571 | 3 | 0 | 3 |
| PTTG2 | SRY | 0.635564 | 3 | 0 | 3 |
| PTTG2 | NOP56 | 0.633226 | 3 | 0 | 3 |
| PTTG2 | CKAP2L | 0.630287 | 4 | 0 | 3 |
| PTTG2 | PSME2 | 0.625744 | 3 | 0 | 3 |
| PTTG2 | JAG1 | 0.624474 | 3 | 0 | 3 |
| PTTG2 | PARPBP | 0.617835 | 3 | 0 | 3 |
For details and further investigation, click here