| Full name: tumor protein p53 binding protein 1 | Alias Symbol: 53BP1|p202|TDRD30 | ||
| Type: protein-coding gene | Cytoband: 15q15.3 | ||
| Entrez ID: 7158 | HGNC ID: HGNC:11999 | Ensembl Gene: ENSG00000067369 | OMIM ID: 605230 |
Screen Evidence:
| |||
Expression of TP53BP1:
| Dataset | Gene | EntrezID | Probe | Log2FC | Adj.pValue | Expression |
|---|---|---|---|---|---|---|
| GSE17351 | TP53BP1 | 7158 | 203050_at | 0.2422 | 0.3624 | |
| GSE20347 | TP53BP1 | 7158 | 203050_at | 0.4712 | 0.0000 | |
| GSE23400 | TP53BP1 | 7158 | 203050_at | 0.2561 | 0.0000 | |
| GSE26886 | TP53BP1 | 7158 | 203050_at | 0.8077 | 0.0002 | |
| GSE29001 | TP53BP1 | 7158 | 203050_at | 0.3580 | 0.0679 | |
| GSE38129 | TP53BP1 | 7158 | 203050_at | 0.4839 | 0.0000 | |
| GSE45670 | TP53BP1 | 7158 | 203050_at | 0.3925 | 0.0088 | |
| GSE53622 | TP53BP1 | 7158 | 26658 | 0.5508 | 0.0000 | |
| GSE53624 | TP53BP1 | 7158 | 26658 | 0.5313 | 0.0000 | |
| GSE63941 | TP53BP1 | 7158 | 203050_at | -0.5537 | 0.1293 | |
| GSE77861 | TP53BP1 | 7158 | 203050_at | 0.3082 | 0.0159 | |
| GSE97050 | TP53BP1 | 7158 | A_23_P88703 | -0.1459 | 0.5127 | |
| SRP007169 | TP53BP1 | 7158 | RNAseq | 2.2802 | 0.0000 | |
| SRP008496 | TP53BP1 | 7158 | RNAseq | 2.4226 | 0.0000 | |
| SRP064894 | TP53BP1 | 7158 | RNAseq | 0.3339 | 0.0422 | |
| SRP133303 | TP53BP1 | 7158 | RNAseq | 0.2791 | 0.0195 | |
| SRP159526 | TP53BP1 | 7158 | RNAseq | 0.5151 | 0.0349 | |
| SRP193095 | TP53BP1 | 7158 | RNAseq | 0.6307 | 0.0000 | |
| SRP219564 | TP53BP1 | 7158 | RNAseq | 0.1665 | 0.6284 | |
| TCGA | TP53BP1 | 7158 | RNAseq | 0.0576 | 0.2398 |
Upregulated datasets: 2; Downregulated datasets: 0.
Survival by TP53BP1 expression:
 | 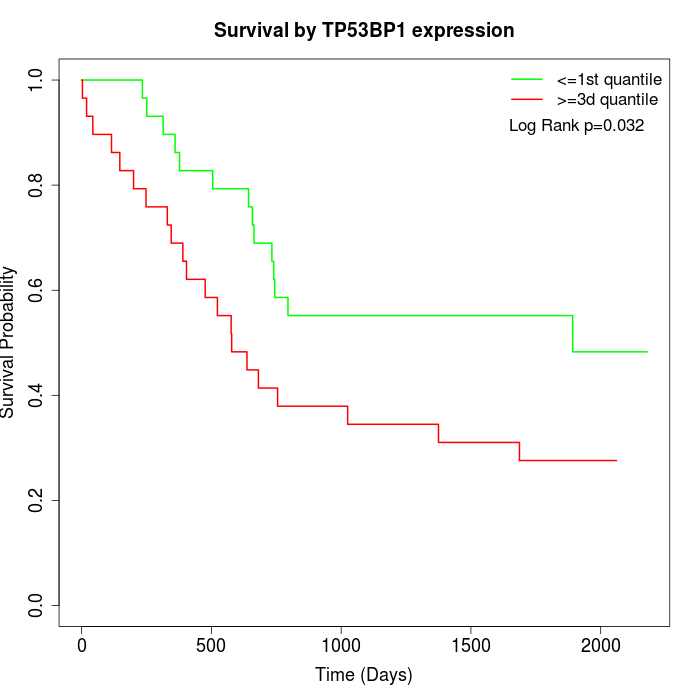 | 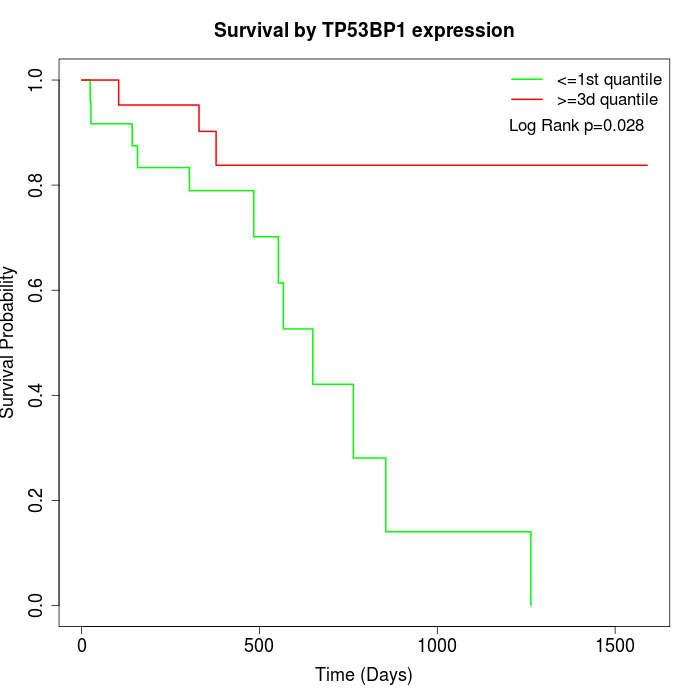 |
| GSE53622 | GSE53624 | TCGA |
Note: Click image to view full size file.
Copy number change of TP53BP1:
| Dataset | Gene | EntrezID | Gain | Loss | Normal | Detail |
|---|---|---|---|---|---|---|
| GSE15526 | TP53BP1 | 7158 | 4 | 4 | 22 | |
| GSE20123 | TP53BP1 | 7158 | 4 | 5 | 21 | |
| GSE43470 | TP53BP1 | 7158 | 3 | 5 | 35 | |
| GSE46452 | TP53BP1 | 7158 | 3 | 7 | 49 | |
| GSE47630 | TP53BP1 | 7158 | 8 | 10 | 22 | |
| GSE54993 | TP53BP1 | 7158 | 4 | 6 | 60 | |
| GSE54994 | TP53BP1 | 7158 | 5 | 7 | 41 | |
| GSE60625 | TP53BP1 | 7158 | 4 | 0 | 7 | |
| GSE74703 | TP53BP1 | 7158 | 3 | 3 | 30 | |
| GSE74704 | TP53BP1 | 7158 | 3 | 2 | 15 | |
| TCGA | TP53BP1 | 7158 | 12 | 17 | 67 |
Total number of gains: 53; Total number of losses: 66; Total Number of normals: 369.
Somatic mutations of TP53BP1:
Generating mutation plots.
Highly correlated genes for TP53BP1:
Showing top 20/376 corelated genes with mean PCC>0.5.
| Gene1 | Gene2 | Mean PCC | Num. Datasets | Num. PCC<0 | Num. PCC>0.5 |
|---|---|---|---|---|---|
| TP53BP1 | AXIN1 | 0.844376 | 3 | 0 | 3 |
| TP53BP1 | ALX1 | 0.834101 | 3 | 0 | 3 |
| TP53BP1 | PRR15 | 0.75678 | 4 | 0 | 4 |
| TP53BP1 | PLEKHA1 | 0.723444 | 3 | 0 | 3 |
| TP53BP1 | ZDHHC8 | 0.69964 | 4 | 0 | 3 |
| TP53BP1 | NPM2 | 0.697408 | 3 | 0 | 3 |
| TP53BP1 | CCDC142 | 0.688346 | 3 | 0 | 3 |
| TP53BP1 | ZNF576 | 0.68299 | 4 | 0 | 3 |
| TP53BP1 | GNB1L | 0.679584 | 6 | 0 | 5 |
| TP53BP1 | QPRT | 0.679117 | 4 | 0 | 4 |
| TP53BP1 | SH3BP4 | 0.675393 | 7 | 0 | 7 |
| TP53BP1 | ABHD11 | 0.672974 | 3 | 0 | 3 |
| TP53BP1 | OBSL1 | 0.672495 | 5 | 0 | 4 |
| TP53BP1 | CDC42EP2 | 0.671686 | 4 | 0 | 3 |
| TP53BP1 | ZMYND15 | 0.669778 | 3 | 0 | 3 |
| TP53BP1 | ZNF446 | 0.663876 | 4 | 0 | 3 |
| TP53BP1 | JAKMIP2 | 0.662722 | 3 | 0 | 3 |
| TP53BP1 | GGT7 | 0.661581 | 5 | 0 | 4 |
| TP53BP1 | DVL2 | 0.654302 | 7 | 0 | 7 |
| TP53BP1 | KAT8 | 0.652644 | 3 | 0 | 3 |
For details and further investigation, click here