| Full name: serpin family G member 1 | Alias Symbol: C1IN|C1-INH|HAE1|HAE2|C1INH | ||
| Type: protein-coding gene | Cytoband: 11q12.1 | ||
| Entrez ID: 710 | HGNC ID: HGNC:1228 | Ensembl Gene: ENSG00000149131 | OMIM ID: 606860 |
| Related drugs: CONESTAT ALFA... [more] | |||
SERPING1 involved pathways:
| KEGG pathway | Description | View |
|---|---|---|
| hsa04610 | Complement and coagulation cascades | |
| hsa05133 | Pertussis |
Expression of SERPING1:
| Dataset | Gene | EntrezID | Probe | Log2FC | Adj.pValue | Expression |
|---|---|---|---|---|---|---|
| GSE17351 | SERPING1 | 710 | 200986_at | -0.3432 | 0.7651 | |
| GSE20347 | SERPING1 | 710 | 200986_at | 0.8836 | 0.0042 | |
| GSE23400 | SERPING1 | 710 | 200986_at | 0.2507 | 0.1915 | |
| GSE26886 | SERPING1 | 710 | 200986_at | 1.2674 | 0.0231 | |
| GSE29001 | SERPING1 | 710 | 200986_at | 1.0791 | 0.0143 | |
| GSE38129 | SERPING1 | 710 | 200986_at | 0.2727 | 0.6138 | |
| GSE45670 | SERPING1 | 710 | 200986_at | -0.9823 | 0.0273 | |
| GSE53622 | SERPING1 | 710 | 105046 | 0.2549 | 0.0628 | |
| GSE53624 | SERPING1 | 710 | 105046 | 0.4173 | 0.0000 | |
| GSE63941 | SERPING1 | 710 | 200986_at | -4.2862 | 0.0000 | |
| GSE77861 | SERPING1 | 710 | 200986_at | 0.5087 | 0.1516 | |
| GSE97050 | SERPING1 | 710 | A_33_P3413989 | 0.3279 | 0.4168 | |
| SRP007169 | SERPING1 | 710 | RNAseq | 4.2629 | 0.0000 | |
| SRP008496 | SERPING1 | 710 | RNAseq | 4.5991 | 0.0000 | |
| SRP064894 | SERPING1 | 710 | RNAseq | 0.6132 | 0.1245 | |
| SRP133303 | SERPING1 | 710 | RNAseq | 0.0464 | 0.8740 | |
| SRP159526 | SERPING1 | 710 | RNAseq | 0.1372 | 0.8105 | |
| SRP193095 | SERPING1 | 710 | RNAseq | 1.4891 | 0.0000 | |
| SRP219564 | SERPING1 | 710 | RNAseq | 0.7181 | 0.2877 | |
| TCGA | SERPING1 | 710 | RNAseq | -0.0931 | 0.3223 |
Upregulated datasets: 5; Downregulated datasets: 1.
Survival by SERPING1 expression:
 | 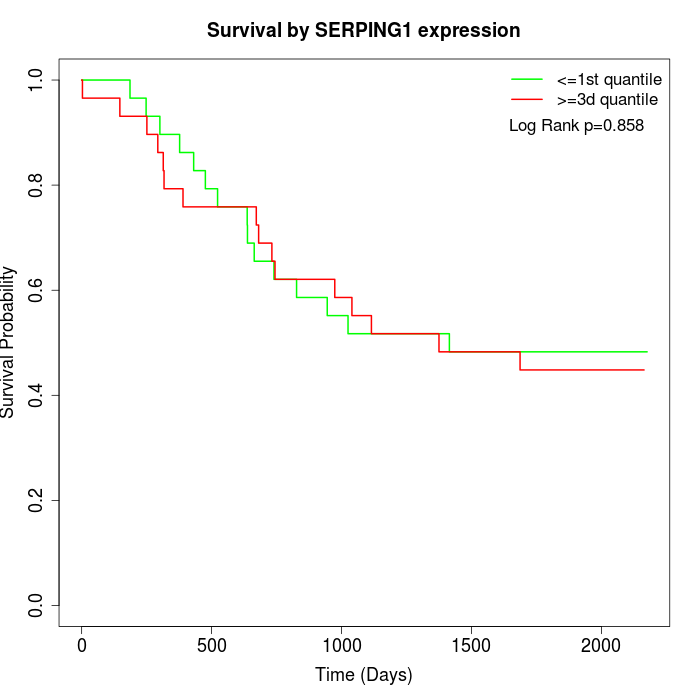 | 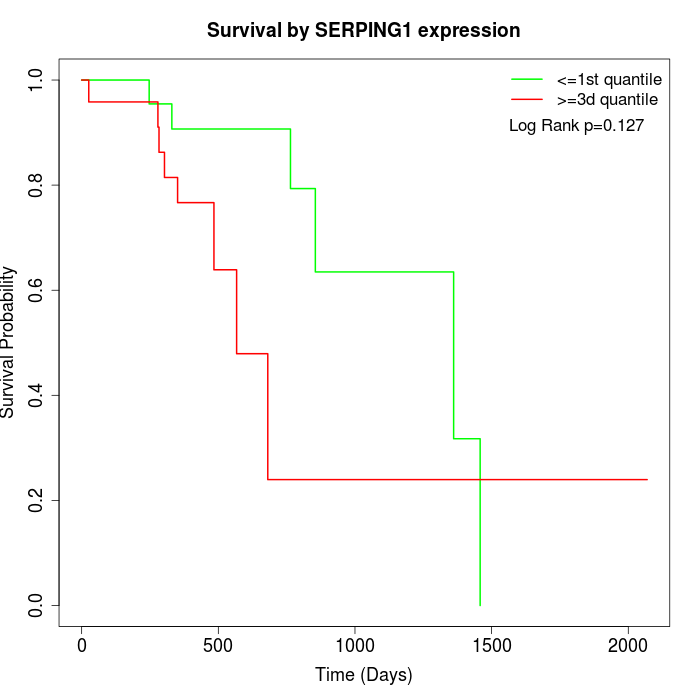 |
| GSE53622 | GSE53624 | TCGA |
Note: Click image to view full size file.
Copy number change of SERPING1:
| Dataset | Gene | EntrezID | Gain | Loss | Normal | Detail |
|---|---|---|---|---|---|---|
| GSE15526 | SERPING1 | 710 | 2 | 3 | 25 | |
| GSE20123 | SERPING1 | 710 | 2 | 3 | 25 | |
| GSE43470 | SERPING1 | 710 | 1 | 5 | 37 | |
| GSE46452 | SERPING1 | 710 | 9 | 4 | 46 | |
| GSE47630 | SERPING1 | 710 | 3 | 8 | 29 | |
| GSE54993 | SERPING1 | 710 | 3 | 0 | 67 | |
| GSE54994 | SERPING1 | 710 | 5 | 6 | 42 | |
| GSE60625 | SERPING1 | 710 | 0 | 3 | 8 | |
| GSE74703 | SERPING1 | 710 | 1 | 3 | 32 | |
| GSE74704 | SERPING1 | 710 | 2 | 3 | 15 | |
| TCGA | SERPING1 | 710 | 14 | 10 | 72 |
Total number of gains: 42; Total number of losses: 48; Total Number of normals: 398.
Somatic mutations of SERPING1:
Generating mutation plots.
Highly correlated genes for SERPING1:
Showing top 20/905 corelated genes with mean PCC>0.5.
| Gene1 | Gene2 | Mean PCC | Num. Datasets | Num. PCC<0 | Num. PCC>0.5 |
|---|---|---|---|---|---|
| SERPING1 | C1S | 0.741045 | 13 | 0 | 12 |
| SERPING1 | C1R | 0.732115 | 13 | 0 | 11 |
| SERPING1 | AEBP1 | 0.706359 | 13 | 0 | 12 |
| SERPING1 | OLFML3 | 0.704395 | 13 | 0 | 13 |
| SERPING1 | PMP22 | 0.699333 | 12 | 0 | 11 |
| SERPING1 | COL6A2 | 0.68549 | 12 | 0 | 10 |
| SERPING1 | C1orf54 | 0.680546 | 13 | 0 | 10 |
| SERPING1 | MMP2 | 0.679481 | 10 | 0 | 9 |
| SERPING1 | TMEM140 | 0.678842 | 13 | 0 | 11 |
| SERPING1 | CTSK | 0.677732 | 13 | 0 | 12 |
| SERPING1 | TMEM229B | 0.676806 | 3 | 0 | 3 |
| SERPING1 | C1QA | 0.675426 | 11 | 0 | 11 |
| SERPING1 | C11orf96 | 0.673332 | 5 | 0 | 5 |
| SERPING1 | MDGA1 | 0.67195 | 3 | 0 | 3 |
| SERPING1 | GLIPR2 | 0.671033 | 9 | 0 | 8 |
| SERPING1 | C1QB | 0.670885 | 11 | 0 | 11 |
| SERPING1 | TGM2 | 0.668383 | 12 | 0 | 11 |
| SERPING1 | FBN1 | 0.667649 | 11 | 0 | 9 |
| SERPING1 | RFTN1 | 0.667461 | 13 | 0 | 10 |
| SERPING1 | CNTNAP1 | 0.666983 | 4 | 0 | 4 |
For details and further investigation, click here