| Full name: SLAIN motif family member 1 | Alias Symbol: FLJ30046 | ||
| Type: protein-coding gene | Cytoband: 13q22.3 | ||
| Entrez ID: 122060 | HGNC ID: HGNC:26387 | Ensembl Gene: ENSG00000139737 | OMIM ID: 610491 |
Expression of SLAIN1:
| Dataset | Gene | EntrezID | Probe | Log2FC | Adj.pValue | Expression |
|---|---|---|---|---|---|---|
| GSE17351 | SLAIN1 | 122060 | 225619_at | 0.2692 | 0.8823 | |
| GSE26886 | SLAIN1 | 122060 | 225619_at | 0.0838 | 0.8387 | |
| GSE45670 | SLAIN1 | 122060 | 225619_at | -1.2283 | 0.0076 | |
| GSE53622 | SLAIN1 | 122060 | 78861 | -1.3508 | 0.0000 | |
| GSE53624 | SLAIN1 | 122060 | 78861 | -1.2750 | 0.0000 | |
| GSE63941 | SLAIN1 | 122060 | 225619_at | 0.9890 | 0.3963 | |
| GSE77861 | SLAIN1 | 122060 | 225619_at | -0.0116 | 0.9176 | |
| GSE97050 | SLAIN1 | 122060 | A_23_P348146 | -0.2115 | 0.6182 | |
| SRP007169 | SLAIN1 | 122060 | RNAseq | 0.4379 | 0.5670 | |
| SRP064894 | SLAIN1 | 122060 | RNAseq | -1.5248 | 0.0000 | |
| SRP133303 | SLAIN1 | 122060 | RNAseq | -0.0858 | 0.8744 | |
| SRP159526 | SLAIN1 | 122060 | RNAseq | 0.3404 | 0.5353 | |
| SRP193095 | SLAIN1 | 122060 | RNAseq | -1.5607 | 0.0000 | |
| SRP219564 | SLAIN1 | 122060 | RNAseq | -0.9894 | 0.0504 | |
| TCGA | SLAIN1 | 122060 | RNAseq | -1.4310 | 0.0000 |
Upregulated datasets: 0; Downregulated datasets: 6.
Survival by SLAIN1 expression:
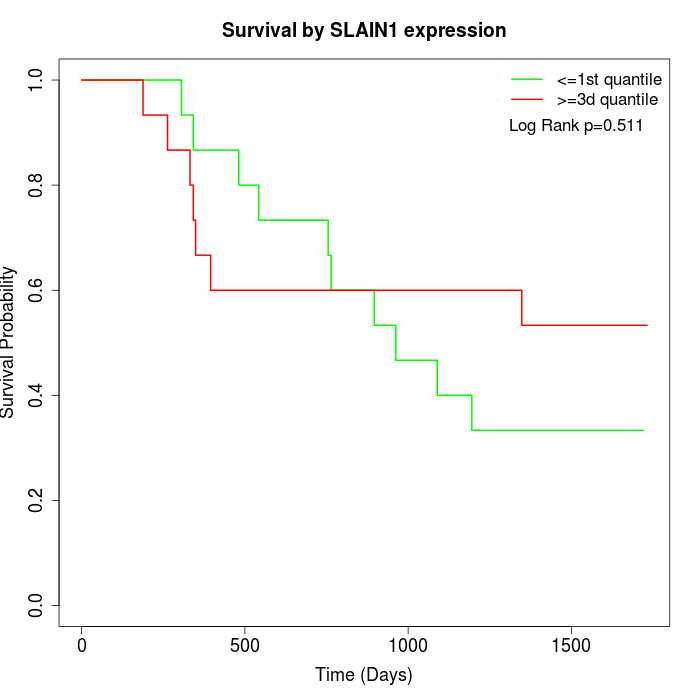 | 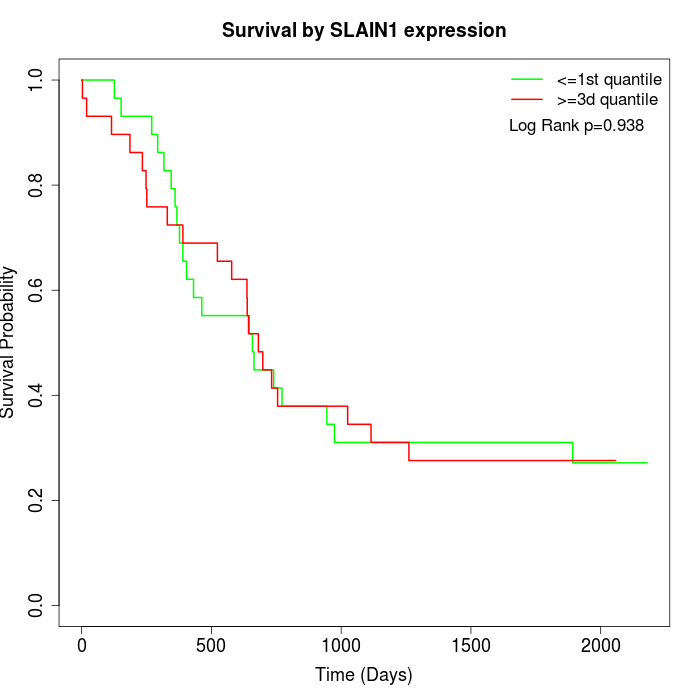 | 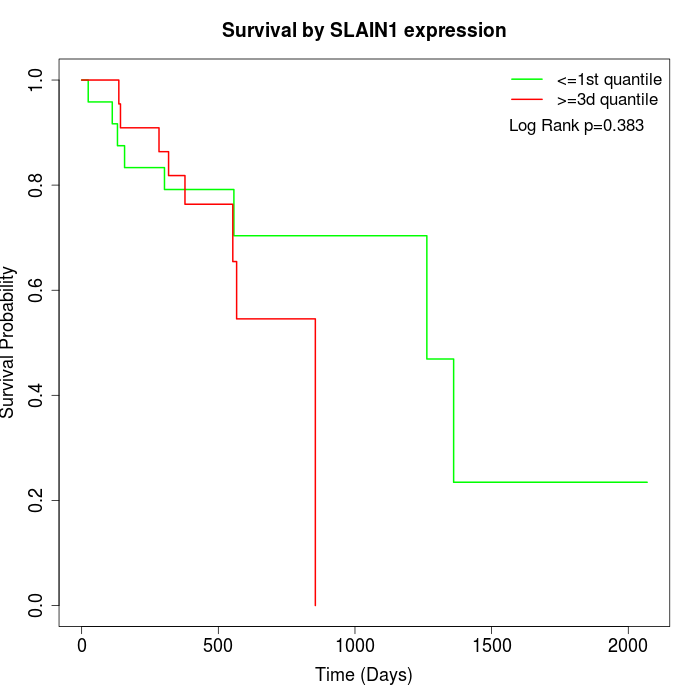 |
| GSE53622 | GSE53624 | TCGA |
Note: Click image to view full size file.
Copy number change of SLAIN1:
| Dataset | Gene | EntrezID | Gain | Loss | Normal | Detail |
|---|---|---|---|---|---|---|
| GSE15526 | SLAIN1 | 122060 | 4 | 11 | 15 | |
| GSE20123 | SLAIN1 | 122060 | 4 | 10 | 16 | |
| GSE43470 | SLAIN1 | 122060 | 4 | 11 | 28 | |
| GSE46452 | SLAIN1 | 122060 | 0 | 32 | 27 | |
| GSE47630 | SLAIN1 | 122060 | 3 | 27 | 10 | |
| GSE54993 | SLAIN1 | 122060 | 11 | 3 | 56 | |
| GSE54994 | SLAIN1 | 122060 | 3 | 14 | 36 | |
| GSE60625 | SLAIN1 | 122060 | 0 | 3 | 8 | |
| GSE74703 | SLAIN1 | 122060 | 3 | 9 | 24 | |
| GSE74704 | SLAIN1 | 122060 | 2 | 9 | 9 | |
| TCGA | SLAIN1 | 122060 | 12 | 33 | 51 |
Total number of gains: 46; Total number of losses: 162; Total Number of normals: 280.
Somatic mutations of SLAIN1:
Generating mutation plots.
Highly correlated genes for SLAIN1:
Showing top 20/587 corelated genes with mean PCC>0.5.
| Gene1 | Gene2 | Mean PCC | Num. Datasets | Num. PCC<0 | Num. PCC>0.5 |
|---|---|---|---|---|---|
| SLAIN1 | TMEM170B | 0.807447 | 6 | 0 | 6 |
| SLAIN1 | SMARCC1 | 0.799159 | 3 | 0 | 3 |
| SLAIN1 | ABHD16A | 0.787183 | 3 | 0 | 3 |
| SLAIN1 | ZNF550 | 0.763661 | 3 | 0 | 3 |
| SLAIN1 | BBX | 0.74858 | 3 | 0 | 3 |
| SLAIN1 | ABCA8 | 0.733868 | 4 | 0 | 4 |
| SLAIN1 | NIPAL3 | 0.727507 | 3 | 0 | 3 |
| SLAIN1 | OMA1 | 0.719707 | 3 | 0 | 3 |
| SLAIN1 | KCNA2 | 0.711744 | 3 | 0 | 3 |
| SLAIN1 | SMARCD2 | 0.71037 | 3 | 0 | 3 |
| SLAIN1 | RCBTB1 | 0.710298 | 3 | 0 | 3 |
| SLAIN1 | KBTBD3 | 0.709936 | 3 | 0 | 3 |
| SLAIN1 | RAB39B | 0.703352 | 4 | 0 | 4 |
| SLAIN1 | DCHS1 | 0.702912 | 3 | 0 | 3 |
| SLAIN1 | TTC17 | 0.701809 | 3 | 0 | 3 |
| SLAIN1 | CKMT2 | 0.700303 | 3 | 0 | 3 |
| SLAIN1 | ETV6 | 0.698926 | 3 | 0 | 3 |
| SLAIN1 | TADA2B | 0.698177 | 3 | 0 | 3 |
| SLAIN1 | RGS5 | 0.696361 | 4 | 0 | 4 |
| SLAIN1 | FAM8A1 | 0.695535 | 3 | 0 | 3 |
For details and further investigation, click here