| Full name: solute carrier family 35 member B1 | Alias Symbol: UGTREL1 | ||
| Type: protein-coding gene | Cytoband: 17q21.33 | ||
| Entrez ID: 10237 | HGNC ID: HGNC:20798 | Ensembl Gene: ENSG00000121073 | OMIM ID: 610790 |
Screen Evidence:
| |||
Expression of SLC35B1:
| Dataset | Gene | EntrezID | Probe | Log2FC | Adj.pValue | Expression |
|---|---|---|---|---|---|---|
| GSE17351 | SLC35B1 | 10237 | 202433_at | 0.2505 | 0.6292 | |
| GSE20347 | SLC35B1 | 10237 | 202433_at | 0.0140 | 0.9381 | |
| GSE23400 | SLC35B1 | 10237 | 202433_at | 0.3234 | 0.0000 | |
| GSE26886 | SLC35B1 | 10237 | 202433_at | -0.1103 | 0.5952 | |
| GSE29001 | SLC35B1 | 10237 | 202433_at | 0.1099 | 0.6814 | |
| GSE38129 | SLC35B1 | 10237 | 202433_at | 0.5205 | 0.0012 | |
| GSE45670 | SLC35B1 | 10237 | 202433_at | 0.4396 | 0.0047 | |
| GSE53622 | SLC35B1 | 10237 | 81537 | 0.4961 | 0.0000 | |
| GSE53624 | SLC35B1 | 10237 | 81537 | 0.4273 | 0.0000 | |
| GSE63941 | SLC35B1 | 10237 | 202433_at | -0.2932 | 0.4382 | |
| GSE77861 | SLC35B1 | 10237 | 202433_at | 0.2245 | 0.2309 | |
| GSE97050 | SLC35B1 | 10237 | A_23_P89455 | 0.8486 | 0.1642 | |
| SRP007169 | SLC35B1 | 10237 | RNAseq | -0.3257 | 0.2908 | |
| SRP008496 | SLC35B1 | 10237 | RNAseq | -0.3364 | 0.0920 | |
| SRP064894 | SLC35B1 | 10237 | RNAseq | 0.3906 | 0.0360 | |
| SRP133303 | SLC35B1 | 10237 | RNAseq | 0.5016 | 0.0016 | |
| SRP159526 | SLC35B1 | 10237 | RNAseq | 0.5741 | 0.0041 | |
| SRP193095 | SLC35B1 | 10237 | RNAseq | -0.1510 | 0.2879 | |
| SRP219564 | SLC35B1 | 10237 | RNAseq | 0.5195 | 0.1964 | |
| TCGA | SLC35B1 | 10237 | RNAseq | 0.0766 | 0.1510 |
Upregulated datasets: 0; Downregulated datasets: 0.
Survival by SLC35B1 expression:
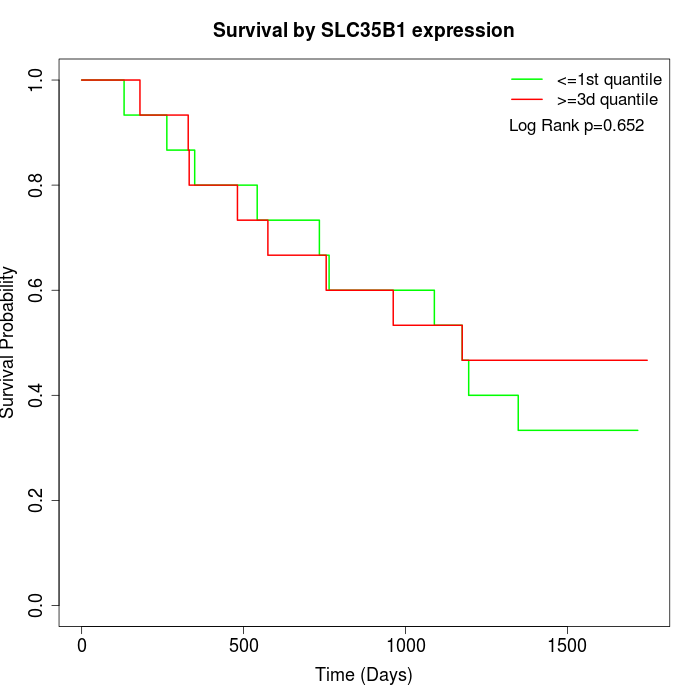 | 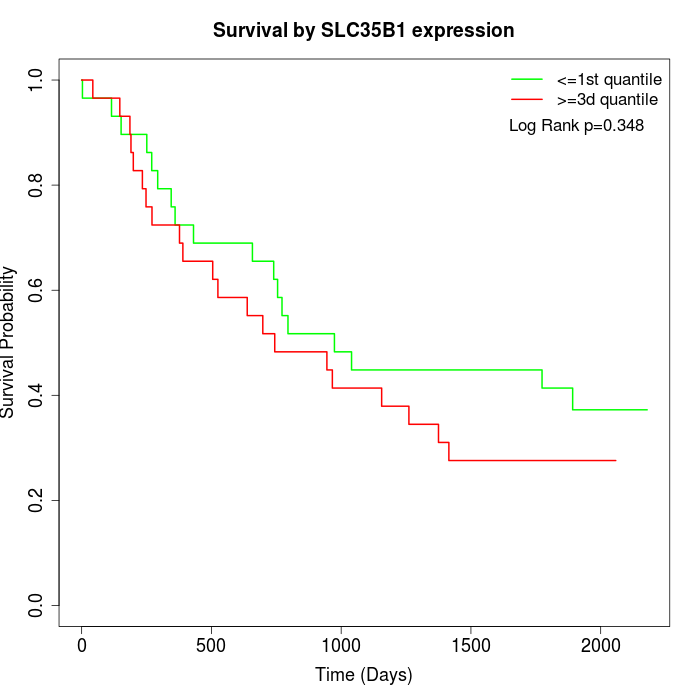 | 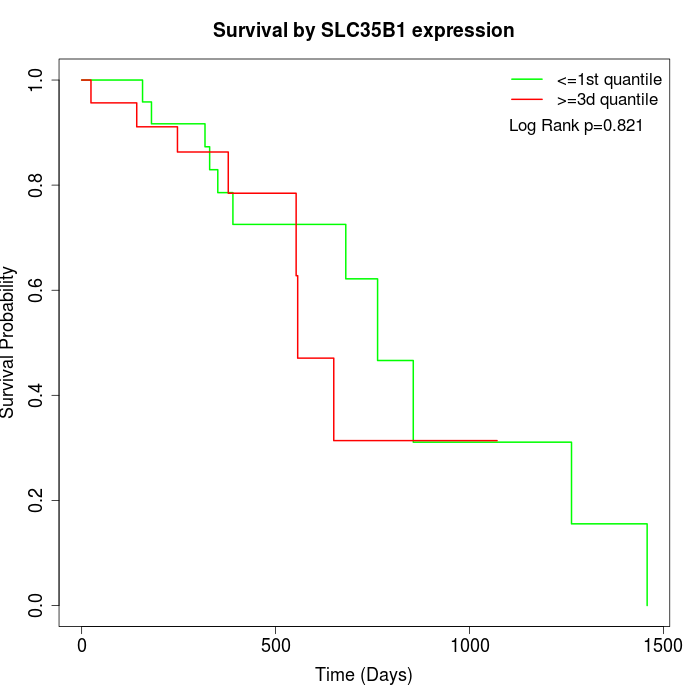 |
| GSE53622 | GSE53624 | TCGA |
Note: Click image to view full size file.
Copy number change of SLC35B1:
| Dataset | Gene | EntrezID | Gain | Loss | Normal | Detail |
|---|---|---|---|---|---|---|
| GSE15526 | SLC35B1 | 10237 | 6 | 2 | 22 | |
| GSE20123 | SLC35B1 | 10237 | 6 | 2 | 22 | |
| GSE43470 | SLC35B1 | 10237 | 3 | 2 | 38 | |
| GSE46452 | SLC35B1 | 10237 | 32 | 0 | 27 | |
| GSE47630 | SLC35B1 | 10237 | 9 | 0 | 31 | |
| GSE54993 | SLC35B1 | 10237 | 2 | 4 | 64 | |
| GSE54994 | SLC35B1 | 10237 | 10 | 5 | 38 | |
| GSE60625 | SLC35B1 | 10237 | 4 | 0 | 7 | |
| GSE74703 | SLC35B1 | 10237 | 3 | 2 | 31 | |
| GSE74704 | SLC35B1 | 10237 | 4 | 1 | 15 | |
| TCGA | SLC35B1 | 10237 | 27 | 7 | 62 |
Total number of gains: 106; Total number of losses: 25; Total Number of normals: 357.
Somatic mutations of SLC35B1:
Generating mutation plots.
Highly correlated genes for SLC35B1:
Showing top 20/1059 corelated genes with mean PCC>0.5.
| Gene1 | Gene2 | Mean PCC | Num. Datasets | Num. PCC<0 | Num. PCC>0.5 |
|---|---|---|---|---|---|
| SLC35B1 | CD53 | 0.729872 | 3 | 0 | 3 |
| SLC35B1 | KTI12 | 0.723947 | 3 | 0 | 3 |
| SLC35B1 | MTHFD1L | 0.710413 | 3 | 0 | 3 |
| SLC35B1 | FAM110A | 0.709034 | 3 | 0 | 3 |
| SLC35B1 | SMG8 | 0.708121 | 11 | 0 | 11 |
| SLC35B1 | ERLIN1 | 0.705262 | 5 | 0 | 5 |
| SLC35B1 | SHMT2 | 0.693924 | 7 | 0 | 7 |
| SLC35B1 | HAS2 | 0.693485 | 3 | 0 | 3 |
| SLC35B1 | MELK | 0.691534 | 7 | 0 | 7 |
| SLC35B1 | NUP50 | 0.684449 | 6 | 0 | 5 |
| SLC35B1 | HDGF | 0.683135 | 6 | 0 | 6 |
| SLC35B1 | ESCO2 | 0.681254 | 5 | 0 | 4 |
| SLC35B1 | EBNA1BP2 | 0.681086 | 3 | 0 | 3 |
| SLC35B1 | RECQL | 0.677436 | 4 | 0 | 4 |
| SLC35B1 | NOSIP | 0.674281 | 3 | 0 | 3 |
| SLC35B1 | CEP55 | 0.672769 | 7 | 0 | 6 |
| SLC35B1 | MRPS23 | 0.672487 | 7 | 0 | 5 |
| SLC35B1 | DHX8 | 0.672107 | 10 | 0 | 8 |
| SLC35B1 | TCF19 | 0.671692 | 4 | 0 | 3 |
| SLC35B1 | EFTUD2 | 0.669391 | 6 | 0 | 4 |
For details and further investigation, click here