| Full name: slit guidance ligand 2 | Alias Symbol: Slit-2 | ||
| Type: protein-coding gene | Cytoband: 4p15.31 | ||
| Entrez ID: 9353 | HGNC ID: HGNC:11086 | Ensembl Gene: ENSG00000145147 | OMIM ID: 603746 |
Screen Evidence:
| |||
SLIT2 involved pathways:
| KEGG pathway | Description | View |
|---|---|---|
| hsa04360 | Axon guidance |
Expression of SLIT2:
| Dataset | Gene | EntrezID | Probe | Log2FC | Adj.pValue | Expression |
|---|---|---|---|---|---|---|
| GSE17351 | SLIT2 | 9353 | 209897_s_at | -1.7013 | 0.1938 | |
| GSE20347 | SLIT2 | 9353 | 209897_s_at | -0.2778 | 0.1603 | |
| GSE23400 | SLIT2 | 9353 | 209897_s_at | -0.4356 | 0.0052 | |
| GSE26886 | SLIT2 | 9353 | 209897_s_at | 0.7111 | 0.0171 | |
| GSE29001 | SLIT2 | 9353 | 209897_s_at | 0.2306 | 0.5001 | |
| GSE38129 | SLIT2 | 9353 | 209897_s_at | -0.8068 | 0.0374 | |
| GSE45670 | SLIT2 | 9353 | 209897_s_at | -1.9510 | 0.0000 | |
| GSE53622 | SLIT2 | 9353 | 40486 | -0.8646 | 0.0001 | |
| GSE53624 | SLIT2 | 9353 | 40486 | -0.7024 | 0.0002 | |
| GSE63941 | SLIT2 | 9353 | 209897_s_at | -1.6921 | 0.2098 | |
| GSE77861 | SLIT2 | 9353 | 209897_s_at | 0.3190 | 0.0703 | |
| GSE97050 | SLIT2 | 9353 | A_23_P144348 | -1.0649 | 0.1186 | |
| SRP007169 | SLIT2 | 9353 | RNAseq | 3.6234 | 0.0000 | |
| SRP008496 | SLIT2 | 9353 | RNAseq | 4.0037 | 0.0000 | |
| SRP064894 | SLIT2 | 9353 | RNAseq | -0.0074 | 0.9863 | |
| SRP133303 | SLIT2 | 9353 | RNAseq | -0.8178 | 0.0663 | |
| SRP159526 | SLIT2 | 9353 | RNAseq | 0.6605 | 0.2188 | |
| SRP193095 | SLIT2 | 9353 | RNAseq | 0.1403 | 0.6060 | |
| SRP219564 | SLIT2 | 9353 | RNAseq | 0.4158 | 0.7268 | |
| TCGA | SLIT2 | 9353 | RNAseq | -0.7991 | 0.0039 |
Upregulated datasets: 2; Downregulated datasets: 1.
Survival by SLIT2 expression:
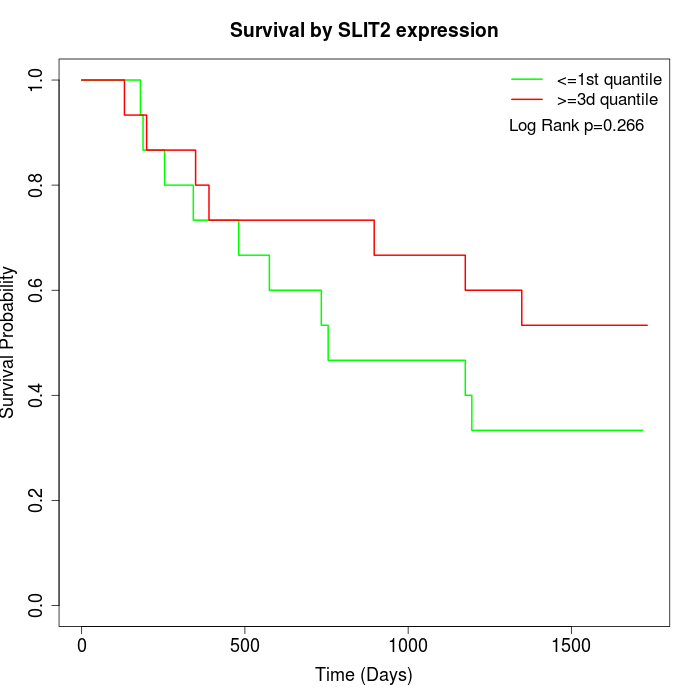 | 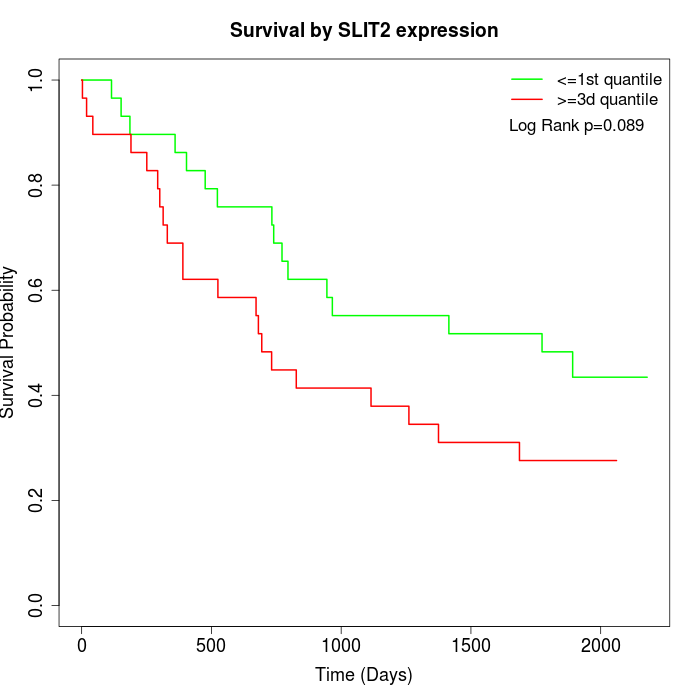 | 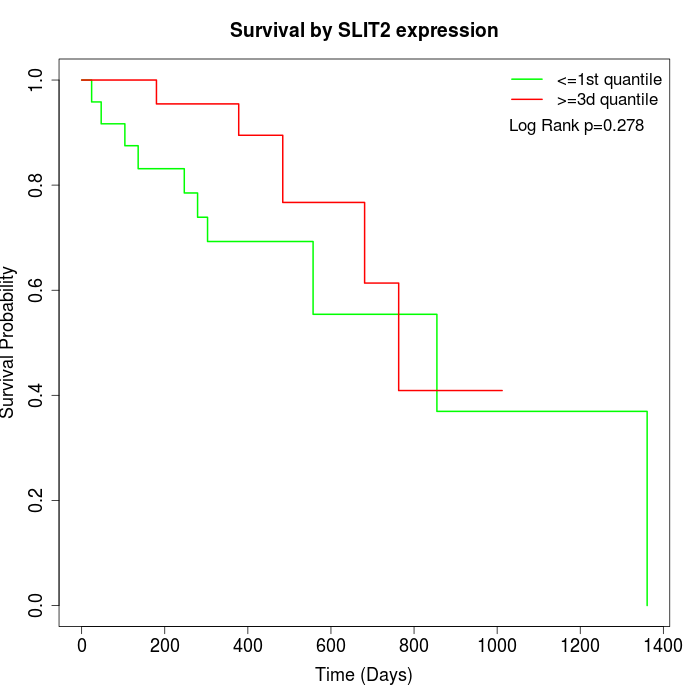 |
| GSE53622 | GSE53624 | TCGA |
Note: Click image to view full size file.
Copy number change of SLIT2:
| Dataset | Gene | EntrezID | Gain | Loss | Normal | Detail |
|---|---|---|---|---|---|---|
| GSE15526 | SLIT2 | 9353 | 0 | 18 | 12 | |
| GSE20123 | SLIT2 | 9353 | 0 | 18 | 12 | |
| GSE43470 | SLIT2 | 9353 | 0 | 15 | 28 | |
| GSE46452 | SLIT2 | 9353 | 1 | 36 | 22 | |
| GSE47630 | SLIT2 | 9353 | 1 | 19 | 20 | |
| GSE54993 | SLIT2 | 9353 | 9 | 0 | 61 | |
| GSE54994 | SLIT2 | 9353 | 4 | 12 | 37 | |
| GSE60625 | SLIT2 | 9353 | 0 | 0 | 11 | |
| GSE74703 | SLIT2 | 9353 | 0 | 13 | 23 | |
| GSE74704 | SLIT2 | 9353 | 0 | 11 | 9 | |
| TCGA | SLIT2 | 9353 | 9 | 48 | 39 |
Total number of gains: 24; Total number of losses: 190; Total Number of normals: 274.
Somatic mutations of SLIT2:
Generating mutation plots.
Highly correlated genes for SLIT2:
Showing top 20/1093 corelated genes with mean PCC>0.5.
| Gene1 | Gene2 | Mean PCC | Num. Datasets | Num. PCC<0 | Num. PCC>0.5 |
|---|---|---|---|---|---|
| SLIT2 | PGR | 0.832409 | 5 | 0 | 5 |
| SLIT2 | MEOX2 | 0.828274 | 8 | 0 | 8 |
| SLIT2 | RNASE4 | 0.817791 | 5 | 0 | 5 |
| SLIT2 | OGN | 0.815115 | 8 | 0 | 8 |
| SLIT2 | DIXDC1 | 0.810016 | 9 | 0 | 8 |
| SLIT2 | PLP1 | 0.80594 | 7 | 0 | 7 |
| SLIT2 | PEG3 | 0.802296 | 6 | 0 | 6 |
| SLIT2 | CD34 | 0.800236 | 6 | 0 | 6 |
| SLIT2 | MYOC | 0.799076 | 8 | 0 | 8 |
| SLIT2 | PPP1R12B | 0.79635 | 8 | 0 | 8 |
| SLIT2 | ADARB1 | 0.790912 | 7 | 0 | 7 |
| SLIT2 | DMPK | 0.790255 | 6 | 0 | 6 |
| SLIT2 | CASQ2 | 0.789397 | 8 | 0 | 8 |
| SLIT2 | LRFN5 | 0.785435 | 4 | 0 | 4 |
| SLIT2 | DPT | 0.780743 | 8 | 0 | 8 |
| SLIT2 | ANGPTL1 | 0.779714 | 5 | 0 | 5 |
| SLIT2 | LMO3 | 0.778707 | 9 | 0 | 8 |
| SLIT2 | XKR4 | 0.77663 | 5 | 0 | 5 |
| SLIT2 | FLNC | 0.775314 | 8 | 0 | 7 |
| SLIT2 | TMOD1 | 0.773229 | 7 | 0 | 6 |
For details and further investigation, click here